Authors/ Yi-Jyun Shih, Senior Assistant Researcher.
Han Wang, Senior Assistant Researcher.
Hui-Tsen Hsiao, Assistant Researcher.
Wei-Jen Huang, Assistant Researcher.
Aesthetics and Graphics/ Jing-Ying Zhang &Yun-Ting Chu, Research Assistant, RSPRC.
Data Architecture Review/ Kuei-Tien Chou, Director.
David Walther, Research Fellow.
The year 2022 marks the first year of Taiwan's Net-Zero Emissions policy. Let us reflect on Taiwan's current status in energy development. Following its announcement of the "Taiwan's Pathway to Net-Zero Emissions in 2050" in March 2022, the National Development Council has further released the "12 Key Strategies" in December of the same year and amended the "2030 Carbon Reduction Goal", with the intention to progressively achieve a sustainable society with net-zero emissions by 2050. Among these proposals, "energy transition" is the top priority of Taiwan's pathway to net-zero emissions. The government has maximized the deployment of wind and solar power, as well as emphasized the layout of hydrogen energy and the technological development of forward-looking energy, such as geothermal, bioenergy, and ocean energy.
In this edition of Open Energy, the Risk Society and Policy Research Center (RSPRC) will continue to cover the special topic of "Taiwan's Annual Energy Review". Based on a comprehensive inventory of Taiwan's power generation structure, we will compile basic data on Taiwan's energy structure in 2022, as well as analyze the changing trends in national energy consumption, changing trends of electricity consumption, growth trend of electric vehicles in the transportation sector, and development trend of geothermal energy. This will serve as a valuable resource for various sectors and contribute to a deeper understanding of the latest energy development in Taiwan.
This issue's Energy Review has been revised slightly to reflect Taiwan's first steps toward net-zero emissions. First, in response to the accelerated development of geothermal power generation in Taiwan, we have included an update on its progress in geothermal development. A comparison reveals that many geothermal areas are located within traditional indigenous territories. Hence, future large-scale development will necessitate greater emphasis on ensuring a just transition for indigenous people and local communities. Second, we have incorporated a brief tracking and analysis of relevant policies into each section as a separate "Box" for the convenience of readers.
1. Taiwan's power generation structure and proportion of renewable energy types in 2022
- Overall, Taiwan's total power generation in 2022 amounted to 288.148 billion kWh, a decrease of 28.16 billion kWh (0.97%) from 2021. Aligned with Taiwan's energy transition policy goals of "Decrease Coal, Increase Natural Gas, Promote Green Energy, and Achieve Nuclear-Free," the proportion of power generated from renewable energy sources notably rose by 2.27%, increasing from 6.00% to 8.27% Concurrently, power generation from natural gas also saw an uptick by 1.59%. . Conversely, there was a decline in coal-fired power generation by 2.24% and nuclear energy by 1.31%. Other sources such as fuel oil and pumped-storage hydroelectricity decreased slightly by 0.29% and 0.03%, respectively (Bureau of Energy, MOEA, 2023a).
- In 2022, coal remained the dominant source of power generation (42.07%), followed by gas (38.81%), renewable energy (8.27%), nuclear energy (8.24%), fuel oil (1.54%), and pumped-storage hydroelectricity (1.06%)(Bureau of Energy, MOEA, 2023a). It is worth noting that, for the first time, renewable energy has surpassed nuclear energy by 0.03%.
- Thermal power generation remains the primary method in Taiwan, with a capacity of 237.487 billion kWh in 2022, accounting for 82.42% of total power generation. Among these, coal-fired power generation contributed 121.209 billion kWh (42.07%), and gas-fired power contributed 111.828 billion kWh (38.81%) (Bureau of Energy, MOEA, 2023a). Coal-fired power generation has shown a downward trend since 2019, decreasing by 4.11% in 2022 (Bureau of Energy, MOEA, 2023a). In contrast, gas-fired power generation has increased each year since 2019, with a notable increase of 22.69% compared to 2019. This shift aligns with Taiwan's ongoing transition towards cleaner energy sources, marked by a decrease in coal usage and an increase in gas usage.
- With regard to the proportions of different renewable energy types in 2022, solar power accounted for the largest share (3.70%), followed by conventional hydropower (2.03%), wind power (1.23%), biomass energy (0.05%) and geothermal energy (0.01%) (Bureau of Energy, MOEA, 2023a). Compared to 2021, there have been increases in the proportion of power generated from solar, wind, and geothermal energy.
- In 2022, total power generation from renewable energy was 23.843 billion kWh, which had grown by 36.59% in 1 year compared to 17.456 billion kWh in 2021. More specifically, geothermal energy showed the largest increase, from 9 million kWh in 2021 to 25 million kWh in 2021, followed by conventional hydropower (175.60% increase), wind power (60.41% increase) and finally solar photovoltaics (33.97% increase) (Bureau of Energy, MOEA, 2023a).
- Nuclear energy has entered the decommissioning stage as scheduled. Unit 1 of the Second Nuclear Power Plant was shut down in July 2021. Unit 2 will be officially decommissioned after its license expires on March 14, 2023, leading to a gradual decrease in the proportion of nuclear energy each year since 2019. The Third Nuclear Power Plant is also expected to be decommissioned in 2025 as part of the transition towards a nuclear-free country (Bureau of Energy, MOEA, 2023a).
Figure 1-1 Taiwan's power generation structure and amount in 2022
Source: (Bureau of Energy, MOEA, 2023a). Compiled by the RSPRC.
2. Trends in energy consumption across Taiwan
Policy goal
1. Assessment of energy conservation contribution: In its "Key Strategies for Energy Conservation Action Plan (Draft)," the Ministry of Economic Affairs formulated seven strategies to achieve the goal of "maximizing energy efficiency," which encompassed the industrial, commercial, housing, transportation, and other sectors, while also incorporating emerging energy-conservation technologies. The plan will achieve an additional 2.273 kiloliter oil equivalent (KLOE) heat-saving target by 2030( MOEA, 2022c: 5, 6, 13).
2. Energy intensity target: According to the schedule and goals of the energy transition white paper, "Energy Conservation Goals and Pathway Plan," energy intensity should improve by an annual average of 2.4% from 2017 to 2025 (Bureau of Energy, MOEA, 2020: 43).
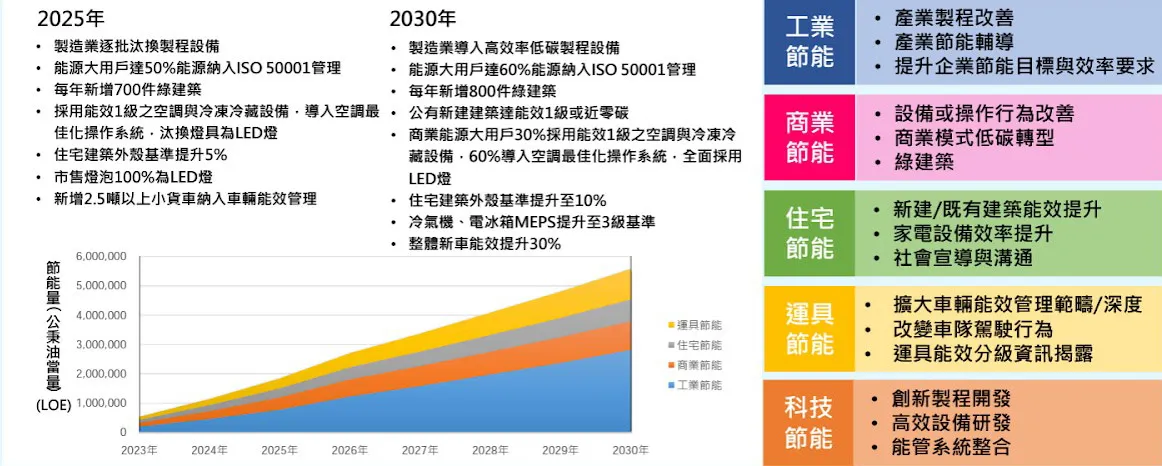
Figure 2-1 Pathway to promoting the energy conservation strategic plan
Source: (Bureau of Energy, MOEA, 2022).
Trend analysis
1. Which sectors in Taiwan consumed the highest amount of energy in 2022?
- In 2022, the total energy consumption was 84.21 million KLOE and showed a negative growth overall, with a decrease of 5.72% compared to 2021 (Bureau of Energy, MOEA, 2023b).
- According to the proportions of energy consumption in 2022, the industrial sector occupied the largest share, accounting for 32.60% of total consumption, followed by the non-energy use sector (26.99%), transportation sector (15.59%), energy sector's consumption (8.62%), service sector (7.04%), and agricultural sector (0.95%) (Bureau of Energy, MOEA, 2023b).
- Upon further examination of the energy consumption changes within the various sectors indicates that compared to 2021, the most substantial decrease in energy consumption in 2022 occurred in the "non-energy use" and "industrial" sectors, decreasing by 14.95% and 5.10%, respectively, contributing to a notable sharp decline in overall energy consumption. The residential sector experienced a decline of 2.65%, whereas the remaining sectors (service, transportation, and agricultural) showed an upward trend (Bureau of Energy, MOEA, 2023b).
Figure 2-2 Energy consumption amount and proportion by sector in 2022
Source: (Bureau of Energy, MOEA, 2023b). Compiled by the RSPRC.
Table 2-1 Comparison of changes in energy consumption across Taiwan between 2021 and 2022 (unit: 10,000 KLOE)
|
Energy Sector’s Consumption |
Industrial Sector |
Transportation Sector |
Agricultural Sector |
Service Sector |
Residential Sector |
Non-Energy Use Sector |
Total |
|
|
Energy Consumption in 2021 |
724.84 |
2,892.62 |
1281.98 |
78.73 |
571.78 |
710.07 |
2,672.57 |
8,932.59 |
|
Energy Consumption in 2022 |
725.85 |
2,744.98 |
1,313.09 |
80.18 |
592.98 |
691.26 |
2,273.13 |
8,421.46 |
|
Energy Consumption Growth Rate in 2022 |
0.14%↑ |
-5.10%↓ |
2.43%↑ |
1.84%↑ |
3.71%↑ |
-2.65%↓ |
-14.95%↓ |
-5.72%↓ |
|
Change in Energy Consumption |
1.01 |
-147.64 |
31.11 |
1.45 |
21.20 |
-18.81 |
-399.44 |
-511.13 |
|
Contribution of Negative Growth Rate |
-0.20% |
28.89% |
-6.09% |
-0.28% |
-4.15% |
3.68% |
78.15% |
100% |
Source: (Bureau of Energy, MOEA, 2023b). Compiled by the RSPRC.
2. What are the trends in energy consumption by different industries in the industrial sector?
- Energy consumption in the industrial sector decreased by 5.10% compared to 2021. All industries showed a downward trend in energy consumption, with the chemical materials manufacturing industry showing the largest decrease (−12.42%), followed by the plastic products manufacturing industry (−8.40%), textile and clothing industry (−7.18%), non-metallic mineral products manufacturing industry (−6.81%), and basic metal industry (−6.02%). The only exception was the computer peripherals and audio-visual electronic products manufacturing industry, which showed a growth in energy consumption (2.94%) (Bureau of Energy, MOEA, 2023c).
Table 2-2 Trends in energy consumption changes by different industries in 2022 (unit: 10,000 KLOE)
|
Textile and Clothing Industry |
The Pulp, Paper, and Paper Products Industry |
Chemical Materials Manufacturing Industry |
Plastic Products Manufacturing Industry |
Non-Metallic Mineral Products Manufacturing Industry |
Basic Metal Industry |
Basic Metal Industry |
Computer Communication and Audio-Visual Electronic Products Manufacturing Industry |
Others |
|
|
2021 |
109.4 |
115.68 |
851.5 |
88.57 |
217.84 |
470.05 |
100.68 |
616.34 |
322.55 |
|
2022 |
101.55 |
112.44 |
745.74 |
81.13 |
203.01 |
441.75 |
99.40 |
634.43 |
325.52 |
|
Change in Energy Consumption |
-7.85 |
-3.24 |
-105.77 |
-7.44 |
-14.83 |
-28.30 |
-1.28 |
18.09 |
2.98 |
|
Energy Consumption Growth Rate vs. 2021 (%) |
-7.18% |
-2.80% |
-12.42% |
-8.40% |
-6.81% |
-6.02% |
-1.27% |
2.94% |
0.92% |
Source: (Bureau of Energy, MOEA, 2023c). Compiled by the RSPRC.
3. What are the trends in energy intensity changes?
- Taiwan's energy intensity has shown sustained improvement since 2016. In 2022, its energy intensity was only 3.89 LOE/NT$ 1,000, which was a decrease of 7.96% from 2021. This aligns with the "Energy Conservation Goals and Pathway Plan" laid out by the Energy Administration to reduce energy intensity by 2.4% per year from 2017 to 2025; additionally, it is higher than the average annual improvement of 2% specified in the Announced Pledges Scenario defined by the International Energy Agency (Bureau of Energy, MOEA, 2020; IEA, 2022: 8).

Box 2.1 Why is there a downward trend in the rate of energy intensity improvement?
Energy intensity is the amount of energy consumed per unit of gross domestic product (GDP) and is calculated by dividing total energy consumption by real GDP. Taiwan's energy intensity declined rapidly in 2022 by 7.96%, the largest decrease in recent years. This notable decrease can mainly be attributed to the decrease in overall energy consumption by 5.72% and the increase in GDP by 2.54% (Bureau of Energy, MOEA, 2023e; DGBAS, 2023a) , which led to the lowest rate of energy intensity improvement in 2022 since 2016.
Figure 2-3 Historical trend of energy intensity from 2016 to 2022
Source: (Bureau of Energy, MOEA, 2023e). Downloaded on February 24, 2023, compiled by the RSPRC.
Note: The rate of energy intensity improvement is the percentage decrease in the total energy supply ratio per unit GDP.
3. Trends in electricity consumption changes across Taiwan
Policy goal
1. Overall development plan for power generation:
Based on the planning principles of clean energy development to promote green energy, increase natural gas, decrease coal, and achieve nuclear-free, the short-term goals are to reach an installed capacity of 20GW for solar photovoltaics and 5.6 GW for offshore wind power by 2025, supplemented by geothermal energy, biomass, and small hydropower, to achieve 15.1% of national power generation by 2025. In terms of gas-fired power generation, there are currently plans to gradually add gas-fired units in the Datan, Hsinta, Sunba, Taichung, Hsieh-ho, Tunghsiao, and other power plants, which is expected to achieve a new installation capacity of 18.84 million kW between 2022 and 2028. In addition, the Ministry of Economic Affairs has directed the CPC Corporation to expedite the construction of the Third Liquefied Natural Gas (LNG) Receiving Terminal, which is expected to be completed in June 2025. With regard to coal-fired power generation, adjustments have been made to the electricity generation of ultra-supercritical units by adopting an electricity mix that is "dominated by gas and supplemented by coal."(Bureau of Energy, MOEA, 2022a).
2. Estimated growth of overall electricity demand:
According to the National Development Council in the "the 2050 Net-Zero Emissions Pathway and Strategy", electrification is the predominant trend in the pathway to net-zero emissions, while the development of livelihood industries and information and communication systems will be instrumental in driving the increase in electricity demand. Therefore, there has been a global growth trend in the electricity demand planning of major countries.
Figure 3-1 shows that from 2021 to 2030, the government will include the electricity demand estimates of large-scale investment projects and sectoral electrification, which is expected to raise electricity demand by more than 20 billion kWh, with an average annual growth of 2.6 ± 0.1%. By 2050, the electricity demand will grow at an average annual rate of 2 ± 0.5%, and the national electricity demand will range between 427.5 and 573.1 billion kWh (National Development Council, 2022a). After taking into account various social and economic conditions, including major investments in domestic industries, policy promotion of vehicle electrification, changes in international economic and trade conditions, and epidemic control measures, the Ministry of Economic Affairs estimates that electricity demand will grow at an average annual rate of 2.3% between 2022 and 2028, with a peak load growth rate of approximately 2.5% (Bureau of Energy, MOEA, 2022b).
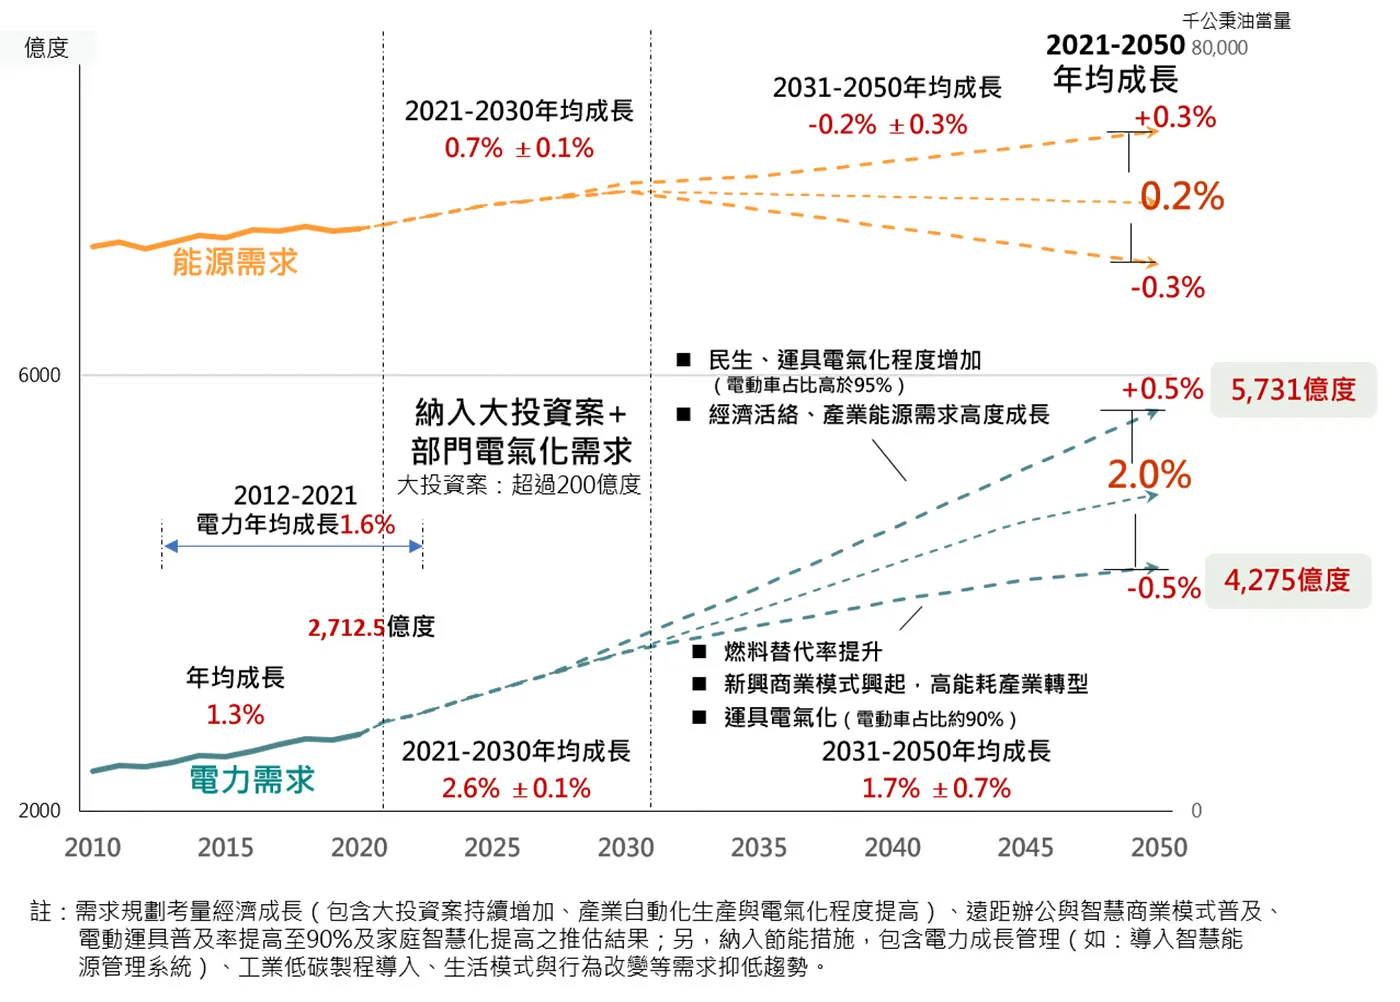
Figure 3-1 Analysis of electricity demand scenario
Source: (National Development Council, 2022a).
Trend analysis
1. Which sectors in Taiwan consumed the most electricity in 2022?
- Based on the proportion of electricity consumption in 2022, the industrial sector accounted for 56.22% of Taiwan's total electricity consumption, the residential sector for 18.22%, and the service sector for 17.02%. Together, these three major sectors consume 90% of electricity in Taiwan (Bureau of Energy, MOEA, 2023f).
- In 2022, the total electricity consumption was 279.8 billion kWh, a slight drop of 1.24% from 2021, mainly due to minor industrial, residential, and agricultural decreases. More specifically, the industrial sector showed the largest decrease at 4.094 billion kWh, followed by the residential sector (-1.753 billion kWh) and the agricultural sector (-45 million kWh)(Bureau of Energy, MOEA, 2023f). Electricity consumption in the transportation, service, and energy sectors increased relative to 2021. The service sector showed the largest increase at 2.123 billion kWh, whereas the energy sector increased by 137 million kWh, and the transportation sector increased by 124 million kWh (Bureau of Energy, MOEA, 2023f).
Figure 3-2 Electricity consumption amount and proportion by sector in 2022
Source:(Bureau of Energy, MOEA, 2023f). Compiled by the RSPRC.
Note:
1. National electricity consumption includes the total electricity sales of the Taipower system, electricity consumed by the energy sector, and electricity generation equipment.
2. There are decimal rounding errors in the percentage sum.
Table 3-1 Trends of electricity consumption changes across Taiwan in 2021 and 2022 (unit: 100 million kWh)
|
Energy Sector’s Consumption |
Industrial Sector |
Transportation Sector |
Agricultural Sector |
Service Sector |
Residential Sector |
Total |
|
|
Electricity Consumption in 2021 |
188.26 | 1614.27 | 15.55 | 33.07 | 455.23 | 527.29 | 2833.68 |
|
Electricity Consumption in 2022 |
189.63 | 1573.33 | 16.78 | 32.62 | 476.46 | 509.77 | 2798.60 |
|
Electricity Consumption Growth Rate in 2022 |
0.73%↑ |
-2.54%↓ |
7.96%↑ |
-1.35%↓ |
4.66%↑ |
-3.32%↓ |
-1.24%↓ |
|
Change in Electricity Consumption |
1.37 | -40.94 | 1.24 | -0.45 | 21.23 | -17.53 | -35.08 |
|
Contribution of Negative Growth Rate |
-3.90% | 116.70% | -3.53% | 1.27% | -60.51% | 49.97% | - |
Source: (Bureau of Energy, MOEA, 2023f). Compiled by the RSPRC.
2. Which industries in the industrial sector consumed the most electricity in 2022?
- In 2022, the electricity consumption of the industrial sector was 157.333 billion kWh, which had decreased by 4.094 billion kWh compared to 2021.
- Upon further examination of the electricity consumption of the various industries in the industrial sector, it is evident that the computer communications and audio-visual electronic product manufacturing industry (from now on referred to as the electronics industry) consumed the largest amount of electricity, at 62.103 billion kWh, accounting for nearly 40% of all industrial electricity consumption. The electronics industry is followed by the chemical materials manufacturing industry (30.19 billion kWh) and the basic metal industry (18.15 billion kWh). These three industries account for more than 70% of the total industrial electricity consumption (Bureau of Energy, MOEA, 2023f).
- A comparison of the changes in electricity consumption from 2021 to 2022 indicates that only the electronics industry increased by 2.040 billion kWh, whereas the other industries showed a decrease in electricity consumption (Bureau of Energy, MOEA, 2023f). Among these, the chemical materials manufacturing industry decreased by 3.354 billion kWh, the basic metal industry by 1.636 billion kWh, the textiles and clothing industry by 585 million kWh, and the remaining industries (not including "Others") by less than 500 million kWh.
Figure 3-3 Proportion of electricity consumption by different industries in the industrial sector in 2022
Source:(Bureau of Energy, MOEA, 2023f). Compiled by the RSPRC.
Note: There are decimal rounding errors in the percentage sum.
Figure 3-4 Trends in electricity consumption changes in the industrial sector in 2022 (unit: 100 million kWh)
Box 3.1 Analysis of Power Consumption
1. The rise in electricity prices has prompted major industrial electricity consumers to review their electricity consumption and improve their electricity-saving rate
At the end of June 2022, the electricity price review committee decided to raise electricity prices by 15% for major industrial consumers of high-voltage and ultra-high-voltage electricity, which commenced on July 1. Following the rise in electricity prices, the overall industrial electricity consumption in 2022 decreased by 4.094 billion kWh, which was 2.54% lower compared to 2021, and the month-by-month decrease in industrial electricity consumption was particularly prominent starting from July (Bureau of Energy, MOEA, 2023f).
2. The post-pandemic return to normal contributed to the decrease in residential electricity consumption
As pandemic restrictions were lifted and the public gradually returned to their pre-pandemic lifestyle, the overall residential electricity consumption in 2022 was 50.977 billion kWh, which had fallen by 1.753 billion kWh compared to 2021(Bureau of Energy, MOEA, 2023f).
3. Growth of electricity consumption in the service sector driven by economic recovery in the post-pandemic era
As the pandemic in Taiwan subsided to a stable and controllable level, coupled with stimulus from the revitalization of the five-fold coupon and the bonus coupon policy of various ministries and commissions, private consumption showed a positive growth in the third and fourth quarters of 2022 (DGBAS, 2023b), which indirectly drove substantial increases in the electricity consumption of the warehousing industry, accommodation and catering industry, social services and personal services industry, and wholesale and retail service industries. The electricity consumption of the overall service sector was approximately 47.646 billion kWh, which had increased by approximately 2.123 billion kWh compared to 2021, making it the sector with the largest increase in electricity consumption (Bureau of Energy, MOEA, 2023f).
4. Electricity consumption in the electronics industry will continue to grow
In 2022, the electricity consumption of the electronics industry was 62.103 billion kWh, accounting for nearly 40% of all industrial electricity consumption. It is the only industry to show an increase in electricity consumption (+2.040 billion kWh) compared to 2021, whereas that of other industries in the industrial sector showed negative growth. According to the "2021 National Electricity Supply and Demand Report" released in July 2022 by the Ministry of Economic Affairs, under the base period of high electricity consumption growth in 2021, it has included future expansion plans in the domestic semiconductor industry, investment and production expansion by returning Taiwanese businesses, and other relevant electricity demands. Based on this, the average annual growth rate in electricity demand from 2022 to 2028 is estimated to reach 2.3%.
4. Growth trend of electric vehicles in the transportation sector
Policy goal
1. Increase the number of electric vehicles: According to the National Development Council's Pathway to Net-Zero Emissions by 2050 plan, urban buses, and official cars will be fully electrified by 2030, and the sales ratio of electric cars and motorcycles will be 100% (Ministry of Transportation and Communications, 2023).
2. Improve the use of environmental supporting facilities: The Ministry of Transportation and Communications will assist in setting up electric vehicle charging and battery swapping facilities in areas under its jurisdiction, such as national highway service areas, public parking lots, and transportation hubs. It is expected to set up 6,000 slow-charging stations and 500 fast-charging stations by 2025 (Ministry of Transportation and Communications, 2023).
3. Upgrade and transition of industrial technology: By 2030, the market sales ratio of electric cars and electric motorcycles will account for 30% and 35%, respectively, of which domestic electric cars will account for at least 50% of new cars by 2030 (Ministry of Transportation and Communications, 2023).
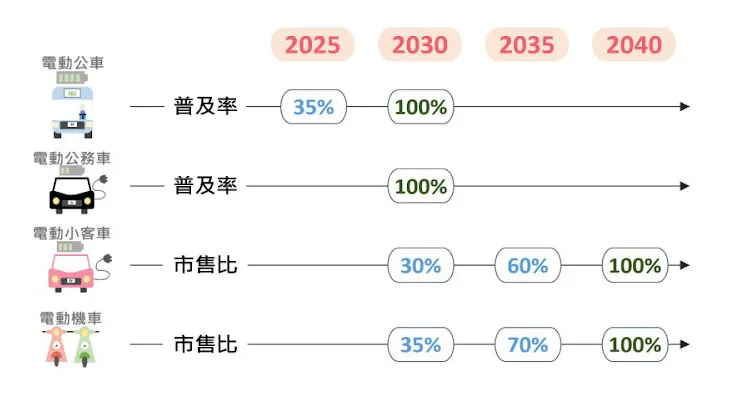
Figure 4-1 Milestones in the electrification of vehicles
Source: (Ministry of Transportation and Communications, 2023).
Figure 4-2 Share of electric vehicles in new car sales and phased promotion targets
Trend analysis
1. Electric vehicles
- As shown in Table 4-1, the number of newly licensed plates for pure electric cars in 2022 increased significantly by 128% compared to 2021, growing more than two-fold. Tables 4-2 and 4-3 demonstrate that although the sales volume of electric cars showed a trend of yearly increase, its market share was still less than 5% (4.00%) and penetration rate less than 1% (0.43%).
- In 2022, the number of newly licensed plates for electric buses reached a new high, accounting for nearly 50% of all newly purchased buses, and there was significant annual growth from 2020 to 2022 (see Table 4-2). As of the end of 2022, there were only 1,170 electric buses among more than 15,000 buses nationwide, with a penetration rate of 7.7%, which was only one-fifth of the mid-term target for 2025 (see Table 4-3).
Table 4-1 Trends in the registration and licensing of pure electric cars in 2021-2022 (unit: vehicles)
|
Month |
2021 |
2022 |
|||
|
Number of Newly Licensed Plates |
Number of Newly Licensed Plates |
Number of Newly Licensed Plates |
Number of Newly Licensed Plates |
Growth Relative to the Same Period in 2021 (%) |
|
|
1 |
12,040 |
238 |
19,236 |
216 |
-9% |
|
2 |
12,509 |
475 |
20,089 |
854 |
80% |
|
3 |
13,340 |
836 |
22,065 |
1,993 |
138% |
|
4 |
13,475 |
132 |
22,342 |
284 |
115% |
|
5 |
14,599 |
1,129 |
24,207 |
1,862 |
65% |
|
6 |
15,444 |
858 |
25,124 |
946 |
10% |
|
7 |
15,619 |
183 |
25,401 |
288 |
57% |
|
8 |
16,154 |
548 |
27,441 |
2,041 |
272% |
|
9 |
16,989 |
838 |
28,699 |
1,261 |
50% |
|
10 |
17,167 |
176 |
29,246 |
553 |
214% |
|
11 |
18,532 |
1,356 |
30,642 |
1,407 |
34% |
|
12 |
19,022 |
505 |
35,471 |
4,851 |
861% |
|
Total |
19,022 |
7,274 |
35,471 |
16,556 |
128% |
Source: (Highway Bureau, MOTC, 2023a)、(Highway Bureau, MOTC, 2023b). Compiled by the RSPRC.
Note:
1. Vehicle types include bus, sedan, and light truck.
2. The figures in this table are limited to vehicles with uniform licenses at the end of each month (year). Military and unlicensed vehicles were excluded from the statistics; vehicles with temporary licenses were also excluded.
3. The term "cumulative number of registrations" refers to the number of electric car registrations and not the number of newly licensed plates; this indicates that this figure will change as vehicles are decommissioned and does not represent cumulative sales. The "number of newly licensed plates" can more accurately reflect sales volume.
Table 4-2 Growth trends in the market share of electric vehicles over the past 10 years (unit: vehicles)
|
Vehicle Type |
Large Passenger Vehicles (Excluding Tour Buses) |
Small Passenger Vehicles |
Light Goods Vehicles |
Total |
||||||||
|
Category |
Total Number of Newly Licensed Plates (Including Fuel and Electric) |
Number of Newly Licensed Electric Vehicles |
Proportion of Electric Large Passenger Vehicles Among Newly Licensed Large Passenger Vehicles |
Total Number of Newly Licensed Plates (Including Fuel and Electric) |
Number of Newly Licensed Electric Vehicles |
Proportion of Electric Small Passenger Vehicles Among Newly Licensed Small Passenger Vehicles |
Total Number of Newly Licensed Plates (Including Fuel and Electric) |
Number of Newly Licensed Electric Vehicles |
Proportion of Electric Light Goods Vehicles Among Newly Licensed Light Goods Vehicles |
Total Number of Newly Licensed Plates (Including Fuel and Electric) |
Number of Newly Licensed Electric Vehicles |
Proportion |
|
2013 |
1,546 |
49 |
3.2% |
341,607 |
100 |
0.03% |
26,154 |
5 |
0.02% |
369,307 |
154 |
0.04% |
|
2014 |
1,843 |
48 |
2.6% |
382,840 |
54 |
0.01% |
29,275 |
0 |
0.00% |
413,958 |
102 |
0.02% |
|
2015 |
1,089 |
23 |
2.1% |
379,026 |
56 |
0.01% |
29,393 |
0 |
0.00% |
409,508 |
79 |
0.02% |
|
2016 |
1,249 |
86 |
6.9% |
393,793 |
22 |
0.01% |
34,434 |
0 |
0.00% |
429,476 |
108 |
0.03% |
|
2017 |
1,281 |
57 |
4.4% |
396,190 |
766 |
0.19% |
36,266 |
2 |
0.01% |
433,737 |
825 |
0.19% |
|
2018 |
1,096 |
202 |
18.4% |
384,083 |
598 |
0.16% |
36,752 |
7 |
0.02% |
421,931 |
807 |
0.19% |
|
2019 |
662 |
33 |
5.0% |
383,987 |
3,361 |
0.88% |
40,352 |
0 |
0.00% |
425,001 |
3,394 |
0.80% |
|
2020 |
432 |
98 |
22.7% |
396,345 |
6,243 |
1.58% |
45,640 |
7 |
0.02% |
442,417 |
6,348 |
1.43% |
|
2021 |
560 |
209 |
37.3% |
382,918 |
6,997 |
1.83% |
47,576 |
68 |
0.14% |
431,054 |
7,274 |
1.69% |
|
2022 |
872 |
429 |
49.2% |
364,231 |
16,106 |
4.42% |
49,160 |
15 |
0.03% |
414,263 |
16,550 |
4.00% |
Source: (Highway Bureau, MOTC, 2023b). Compiled by the RSPRC.
Note:
1. Vehicle types include bus(for business use, excluding tour buses), sedan, and light truck.
2. Bus (for business use, excluding tour buses) generally refers to large electric vehicles for the urban or highway passenger transport industry. They are referred to as electric buses in this article.
3. The figures in this table are limited to vehicles with uniform licenses at the end of the month (year). Military and unlicensed vehicles were excluded from the statistics; vehicles with temporary licenses were also excluded.
Table 4-3 Growth trends in the penetration rate of electric cars over the past 10 years (unit: vehicles)
|
Vehicle Type |
Large Passenger Vehicles (for Business Use, Excluding Tour Buses) |
Small Passenger Vehicles |
Light Goods Vehicle |
Total |
||||||||
|
Category |
Total (Including Fuel and Electric) |
Cumulative Number of Registered Electric Vehicles |
Proportion of Electric Large Passenger Vehicles Among the Cumulative Number of Registered Large Passenger Vehicles |
Total (Including Fuel and Electric) |
Cumulative Number of Registered Electric Vehicles |
Proportion of Electric Small Passenger Vehicles Among the Cumulative Number of Registered Small Passenger Vehicles |
Total (Including Fuel and Electric) |
Cumulative Number of Registered Electric Vehicles |
Proportion of Electric Light Goods Vehicles Among the Cumulative Number of Registered Light Goods Vehicles |
Cumulative Number of Registered Vehicles (Including Fuel and Electric) |
Cumulative Number of Registered Electric Vehicles |
Proportion |
|
2013 |
15,084 |
81 |
0.5% |
6,236,879 |
386 |
0.01% |
875,544 |
17 |
0.002% |
7,127,507 |
484 |
0.01% |
|
2014 |
15,315 |
122 |
0.8% |
6,405,778 |
434 |
0.01% |
890,703 |
16 |
0.002% |
7,311,796 |
572 |
0.01% |
|
2015 |
15,500 |
126 |
0.8% |
6,573,746 |
478 |
0.01% |
903,739 |
16 |
0.002% |
7,492,985 |
620 |
0.01% |
|
2016 |
15,663 |
205 |
1.3% |
6,666,006 |
475 |
0.01% |
911,524 |
7 |
0.001% |
7,593,193 |
687 |
0.01% |
|
2017 |
15,890 |
262 |
1.6% |
6,763,422 |
1,236 |
0.02% |
919,294 |
5 |
0.001% |
7,698,606 |
1,503 |
0.02% |
|
2018 |
15,966 |
463 |
2.9% |
6,845,711 |
1,795 |
0.03% |
926,128 |
9 |
0.001% |
7,787,805 |
2,267 |
0.03% |
|
2019 |
15,867 |
473 |
2.98% |
6,919,256 |
5,100 |
0.07% |
934,456 |
6 |
0.001% |
7,869,579 |
5,579 |
0.07% |
|
2020 |
15,782 |
564 |
3.57% |
6,984,750 |
11,194 |
0.16% |
941,016 |
13 |
0.001% |
7,941,548 |
11,771 |
0.15% |
|
2021 |
15,561 |
754 |
4.80% |
7,104,034 |
18,145 |
0.26% |
954,793 |
77 |
0.008% |
8,074,388 |
18,976 |
0.24% |
|
2022 |
15,246 |
1,170 |
7.70% |
7,210,327 |
34,160 |
0.47% |
968,843 |
89 |
0.009% |
8,194,416 |
35,419 |
0.43% |
Source: (Highway Bureau, MOTC, 2023a). Compiled by the RSPRC.
Note:
1. Vehicle types include bus(for business use, excluding tour buses), sedan, and light truck.
2. Bus (for business use, excluding tour buses) commonly referred to as large electric vehicles for the urban or highway passenger transport industry. They are referred to as electric buses in this article.
3. The figures in this table are limited to vehicles with uniform licenses at the end of each month (year). Military and unlicensed vehicles were excluded from the statistics; vehicles with temporary licenses were also excluded.
Box 4.1 Analysis of the electrification of vehicles— electric vehicle
1. Several favorable factors contribute to the growth of electric cars in Taiwan. For example, in early 2023, the Environmental Protection Department announced the "Plan for Replacing Old Cars with Electric Cars," which is expected to continue until 2024. Based on the minimum incentives and subsidies provided by the Environmental Protection Department, individuals who replace their old cars (>10 years) with electric cars will receive at least NT$ 15,000 (Feng, 2023). In addition, Tesla announced at the start of the year that it will introduce price cuts to its car models in line with international trends. The combination of car purchase subsidy policies and price reduction marketing strategies is expected to boost the popularity of electric cars.
2. In 2022, the number of newly licensed plates for electric cars increased significantly by 128% compared to the same period in 2021. The overall trends are as follows: (1) The total number of newly licensed plates in 2022 was 16,106, of which 11,520 were Tesla cars, which accounted for more than 70%(Highway Bureau, MOTC, 2023b). Furthermore, the number of license plates for Tesla cars in 2022 increased by 5,985 compared to 2021, which grew by more than two-fold(Highway Bureau, MOTC, 2023b). Thus, we can speculate that the new car models launched by Tesla are deeply favored by domestic consumers, indirectly driving the overall domestic market for electric cars. (2) Upward trends have been observed in the number of fast- and slow-charging stations across various counties and cities, which have indirectly promoted the public's acceptance of electric cars. Fast-charging stations have grown significantly in Taitung County, Chiayi County, and Tainan City. In contrast, slow-charging stations have grown significantly in Taitung County, Hsinchu County, and Pingtung County(Chen, 2022).
Box 4.2 Analysis of the electrification of vehicles—electric buses
1. In 2020, the Ministry of Transportation and Communications launched the "Subsidy for the Pilot Project of Electric Bus" in 2020, which aimed to provide operators with greater incentives to accelerate the replacement with electric buses, thereby achieving significant increases in the number of newly licensed electric buses from 2020 to 2022.
2. Starting from January 1, 2023, the Ministry of Transportation and Communications will no longer subsidize the purchase of gasoline and diesel buses. It will only subsidize electric buses, in line with the trend of electrifying public buses. Starting from 2023, at the end of the pilot period (2020-2022), electric bus replacement subsidies will no longer distinguish between general and demonstration types but instead will be integrated to form a single-track subsidy method for popularization and promotion. The Highway Bureau of the Ministry of Transportation and Communications and the Environmental Protection Department will subsidize 49% of electric buses (including batteries), with Class A buses capped at NT$ 3.338 million each and Class B buses capped at NT$ 2.6 million each (Ministry of Transportation and Communications, 2023). Whether this latest phase of the electric bus plan will prove effective as a result of the allocated funds remains uncertain and will need to be monitored over the next few years.
2. Electric motorcycles
- As shown in Table 4-4, in contrast to pure electric cars, the number of newly licensed plates for electric motorcycles decreased slightly by 6.71% compared to 2021.
- Figure 4-3 shows that in 2022, electric motorcycles accounted for 11.95% of total motorcycle sales. The current cumulative number of registrations for electric motorcycles has exceeded 630,000; however, this constitutes only 4.38% of the total number of motorcycle registrations, indicating that more than 90% of motorcycles are fueled-powered.
Table 4-4 Trends in the registration and licensing of electric motorcycles in 2021-2022 (unit: vehicles)
|
Month |
2021 |
2022 |
|||
|
Cumulative Number of Registrations |
Number of Newly Licensed Plates |
Cumulative Number of Registrations |
Number of Newly Licensed Plates |
Growth Relative to the Same Period in 2021 (%) |
|
|
1 |
456,941 |
1,443 |
549,197 |
3,025 |
109.63% |
|
2 |
458,399 |
1,705 |
553,320 |
4,283 |
151.20% |
|
3 |
465,457 |
7,338 |
562,772 |
9,757 |
32.97% |
|
4 |
473,672 |
8,467 |
568,921 |
6,419 |
-24.19% |
|
5 |
481,316 |
7,846 |
575,553 |
6,874 |
-12.39% |
|
6 |
487,278 |
6,156 |
583,126 |
7,902 |
28.36% |
|
7 |
494,347 |
7,356 |
590,244 |
7,436 |
1.09% |
|
8 |
501,654 |
7,660 |
597,553 |
7,737 |
1.01% |
|
9 |
510,734 |
9,372 |
605,941 |
8,753 |
-6.60% |
|
10 |
521,336 |
10,910 |
613,087 |
7,514 |
-31.13% |
|
11 |
532,933 |
11,870 |
621,580 |
8,852 |
-25.43% |
|
12 |
546,438 |
13,876 |
630,223 |
9,138 |
-34.15% |
|
Total |
546,438 |
94,000 |
630,223 |
87,690 |
-6.71% |
Source:(Highway Bureau, MOTC, 2023a)、(Highway Bureau, MOTC, 2023b). Compiled by the RSPRC.
Note:
1. In response to the growth targets for electric vehicles in the "Key Strategies for ‘Electrified and Carbon-Free Transportation Vehicles' Action Plan" proposed by the Ministry of Transportation and Communications, this edition of Taiwan's Annual Energy Review will differ slightly from previous years. In addition to data on ordinary heavy-duty motorcycles, ordinary light-duty motorcycles, and small light-duty motorcycles, we have also included data on large heavy-duty motorcycles for the first time.
2. The figures in this table are limited to vehicles with uniform licenses at the end of each month (year) and do not include unlicensed vehicles or vehicles with temporary licenses.
3. The "cumulative number of registrations" refers to the number of electric car registrations, not the number of newly licensed plates; this means this figure will change as vehicles are decommissioned and does not represent cumulative sales. The "number of newly licensed plates" can more accurately reflect sales volume.
Figure 4-3 Growth trends in the market share of electric motorcycles over the past 10 years (unit: vehicles)
Source:(Highway Bureau, MOTC, 2023a)、(Highway Bureau, MOTC, 2023b). Compiled by the RSPRC.
Note:
1. Vehicle types include large heavy-duty, ordinary light-duty motorcycles, and small light-duty motorcycles.
2. The figures in this table are limited to vehicles with new uniform licenses at the end of each month (year) and do not include unlicensed vehicles or vehicles with temporary licenses.
3. Market share: number of newly licensed plates for electric motorcycles each year ÷ total number of newly licensed plates.
Box 4.3 Analysis of the electrification of vehicles—electric motorcycles
1. In the first half of 2022, newly licensed plates grew, mainly due to the limited bonus subsidies introduced by certain counties and cities to stimulate sales. In the second half, negative growth was observed for 4 consecutive months. One of the reasons may have been because the leading electric motorcycle brand announced a comprehensive increase in battery tariffs starting from April 1, 2022, which reduced the public's intention to purchase.
2. Since the Executive Yuan proposed the plan to phase out fuel-powered vehicles in 2017, the market share of electric motorcycles exceeded the 5% mark in 2018 and even reached a record high of 18.68% in 2019; this can mainly be attributed to the subsidies for purchasing electric motorcycles introduced by various counties and cities, continuous improvements in charging facilities and novel vehicle designs, which have attracted many young consumers (Kang, 2019). In 2020, the Environmental Protection Department introduced subsidies for replacing old motorcycles with new Phase 7 fuel-powered ones. Thus, the subsidies for Phase 7 fuel-powered motorcycles far exceeded that of electric motorcycles, which caused the latter's market share to decrease by 9.10% compared to 2019. In 2022, the Environmental Protection Department completely ceased the replacement subsidies for Phase 7 fuel-powered motorcycles, which led to a slight increase of 0.33% in the market share of electric motorcycles compared to 2021.
5. Development trends in geothermal energy
Policy goal
- At the end of December 2022, the Executive Yuan passed amendments to the Renewable Energy Development Act, which was reviewed by the Legislative Yuan. The amendments included the addition of specific provisions for geothermal energy.
- On December 28, 2022, the National Development Council held a press conference on the "Phased Targets and Key Strategies for Net-Zero Transition" to announce the phased targets and action plan to achieve net-zero transition. Among these, the geothermal targets were 20 MW by 2025, 56-192 MW by 2030 (National Development Council, 2022b), and a leap to 3-6.2 GW by 2050 (Liao, 2023). Increasing the annual geothermal target from 2030 will be necessary to bridge this large gap.
- In 2023-2024, the public sector will implement 8-10 geothermal exploration projects involving 20,000 m of drilling (Ministry of Economic Affairs, 2023).
Trend analysis
- Taiwan's power generation potential from traditional geothermal energy is only approximately 990 MW (see potential areas in Figure 5-1). However, according to the latest assessment of the Central Geological Survey, Taiwan's geothermal potential can reach up to 40 GW with the addition of deep geothermal energy (Bureau of Energy, MOEA, 2023g). Therefore, the development of deep geothermal energy is imperative for achieving the 2050 policy goal (3-6.2 GW).
- Currently, the potential areas for traditional geothermal power generation in Taiwan and the Datun Mountain area are mainly in Yilan County and Taitung County (see Figure 5-1).
- Among the potential areas in Yilan County, the Qingshui Geothermal Power Plant (4.5 MW) has commenced operations, whereas the Yilan Tuchang Geothermal Power Plant has a total planned capacity of 4.9 MW.
- The Zhiben Geothermal Power Plant (0.01 MW) and Jinlun Geothermal Power Plant have begun generating electricity within Taitung County. Although the Jinlun Geothermal Power Plant is still under construction among the one-stop-shops for geothermal power generation, the Economic Daily News reported that it was officially connected to the grid for commercial transmission in November 2022, with an installed capacity of 500 KW (Chen, 2022).
- Taitung County has a total geothermal capacity of approximately 34.66 MW under construction, making it the county with the greatest geothermal capacity in Taiwan.
- However, based on one-stop-shops for geothermal power generation, Taiwan currently has a geothermal capacity of only 60 MW, even after considering both installed and planned capacity.
- According to the latest external information released by the Energy Administration of the Ministry of Economic Affairs on March 4, 2023, 21 projects on eight sites are "under development, construction, or completion," with a total installed capacity of 54.8 MW. As of the end of 2022, 5.45 MW of geothermal capacity has been installed (Bureau of Energy, MOEA, 2023g).
- In Taiwan, 40.6% of potential geothermal resources are in indigenous areas, and 87.8% of geothermal projects are under construction. If we exclude the geothermal potential area of the non-indigenous area in Datun Mountain (accounting for 51.9%), then 84.4% of the geothermal potential is in traditional indigenous areas. Therefore, for Taiwan's future geothermal development to achieve the target of 3-6.3 GW by 2050, it will be necessary to strengthen the rights and interests of indigenous peoples protected by the Indigenous Peoples Basic Law and carefully design communication and participation mechanisms for indigenous peoples.
- Geothermal development requires substantial investment and involves complex administrative procedures. However, the government has gradually simplified various administrative procedures to promote its development. For example, when the "Standards for Determining Specific Items and Scope of Environmental Impact Assessments for Development Activities" was amended in 2018, the geothermal development capacity requiring environmental impact assessment was relaxed to 10 MW.
Figure 5-1. Potential areas for geothermal development and installed/planned capacity (unit: MW)
Source:(Bureau of Energy, MOEA, 2022d)、(The Single Service Window for Taiwan Geothermal Power, 2023)、(Central Geological Survey, MOEA,2021). Compiled by the RSPRC.
Table 5-1. Comparison of estimated geothermal potential and capacity in operation/under construction/under planning across Taiwan with the proportion in indigenous areas (unit: MW)
|
Estimated Potential |
Capacity in Operation |
Capacity under Construction |
Capacity under Planning |
|
|
Taiwan Subtotal |
990.2 |
4.51 |
50.889 |
3.5 |
|
Indigenous Area Subtotal |
402 |
4.51 |
44.69 |
0 |
|
Indigenous Area Percentage |
40.6% |
100.0% |
87.8% |
0.0% |
Source:(Bureau of Energy, MOEA, 2022d)、(The Single Service Window for Taiwan Geothermal Power, 2023)、(Central Geological Survey, MOEA,2021). Compiled by the RSPRC.
Note:
1. Table 5-1 shows the subtotal of estimated potential for Taiwan. The data comes from the Energy Administration of the Ministry of Economic Affairs_Taiwan Geothermal Power Generation Information.
2. Data on capacity in operation, under construction, and planning came from the Single Service Window for Taiwan Geothermal Power. "Under construction" is defined as projects that have (1) applied for electricity industry construction, (2) applied for the registration of renewable energy power generation equipment, and (3) commenced drilling operations; others are classified as under planning.
Box 5.1 Geothermal resource potential of the Keelung Submarine Volcano area
Geothermal resources of the Keelung Submarine Volcano area: Just beyond the Hsieh-Ho Power Plant in Waimushan at the northeastern corner of Taiwan, the Xin-Lai Submarine Volcano can be found between Keelung Islet and Yehliu. This active volcano has an abundant geothermal potential of at least 500 MW(Lee, 2022;Chen, 2022).
- 交通部(Ministry of Transportation and Communications)(2023)。〈臺灣2050淨零轉型「運具電動化及無碳化」關鍵戰略行動計畫(草案)〉。
- 交通部公路總局(Highway Bureau, MOTC)(2023a)。〈機動車輛登記數〉。交通部公路總局統計查詢網。
- 交通部公路總局(Highway Bureau, MOTC)(2023b)。〈新車領牌數〉。交通部公路總局統計查詢網。
- 地熱發電單一服務窗口(The Single Service Window for Taiwan Geothermal Power)(2023)。〈地熱案場分布現況〉網站更新日為2023年2月22日。
- 行政院主計總處(Directorate General of Budget, Accounting and Statistics, Executive Yuan, DGBAS)(2023a)。〈國民所得統計常用資料〉。中華民國統計資訊網。
- 行政院主計總處(DGBAS)(2023b)。〈民間消費統計〉。中華民國統計資訊網。
- 李昭興(Lee, Chao-Shing)(2022)。〈[地熱講堂]--臺灣北海岸的地熱資源〉。
- 國家發展委員會(National Development Council)(2022a)〈臺灣2050淨零排放路徑及策略總說明〉。
- 國家發展委員會(National Development Council)(2022b)〈淨零轉型之階段目標及關鍵戰略-前瞻能源〉。
- 康彰榮(Kang, Jhang-Rong)(2019)。〈台灣電動機車產業邁入快速發展期〉,經貿研究,10月9日。
- 陳彩玲(Chen, Tsai-Ling)(2022)。〈基隆反四接聲浪起 學者推地熱發電廠〉,中國時報,1月11日。
- 陳華焜(Chen, Hua-Kun)(2022)。〈經濟部能源局業界能專計畫10年有成 邁向大型化發展〉,經濟日報,12月6日。
- 馮建棨(Feng, Chien-Chi)(2023)。〈舊車換電動車補助 車齡10年以上可申請〉,工商時報,1月11日。
- 經濟部(Ministry of Economic Affairs)(2022)。《「節能」 關鍵戰略行動計畫 (草案)》。
- 經濟部中央地質調查所(Central Geological Survey, MOEA)(2021)〈地熱探勘資訊平台〉。
- 經濟部中央地質調查所(Central Geological Survey, MOEA)(2023)。〈基隆海底火山區(KSV)地熱資源潛能探勘規劃〉(2023年2月15日,未出版簡報)。
- 經濟部能源局(Bureau of Energy, MOEA)(2020)。《能源轉型白皮書 核定本》。台北:經濟部能源局。
- 經濟部能源局(Bureau of Energy, MOEA)(2022a)〈經濟部公布最新全國電力資源供需報告及110、114年電力排碳係數〉。
- 經濟部能源局(Bureau of Energy, MOEA)(2022b)。《110年度全國電力資源供需報告》。台北:經濟部能源局。
- 經濟部能源局(Bureau of Energy, MOEA)(2022c)。〈2050淨零關鍵戰略 「節能戰略計畫」〉。國家發展委員會。
- 經濟部能源局(Bureau of Energy, MOEA)(2022d)。〈台灣地熱發電資訊〉。政府資料開放平臺。
- 經濟部能源局(Bureau of Energy, MOEA)(2023a)〈能源統計月報 3-02發電量〉。
- 經濟部能源局(Bureau of Energy, MOEA)(2023b)。〈能源統計月報 2-01能源供需概況〉。
- 經濟部能源局(Bureau of Energy, MOEA)(2023c)。〈能源統計月報 2-04工業部門能源消費〉。
- 經濟部能源局(Bureau of Energy, MOEA)(2023d)。〈能源統計月報 2-06住商部門能源消費〉。
- 經濟部能源局(Bureau of Energy, MOEA)(2023e)〈能源統計月報 1-01能源指標〉。
- 經濟部能源局(Bureau of Energy, MOEA)(2023f)〈能源統計月報 3-04電力消費〉。
- 經濟部能源局(Bureau of Energy, MOEA)(2023g)。〈經濟部地熱發展的架構〉(2023年3月4日,未出版簡報)。
- 廖家寧(Liao, Jia-Ning)(2023)。〈拚地熱發電 經部︰2050目標3~6.2GW〉,自由財經,1月10日。
- Chen, Thomas(2022)。 〈2022 上半年台灣各縣市充電站統計:嘉南台東大躍進,桃園要加油了〉,DDCAR電動車,8月13日。
- International Energy Agency (2022). Energy Efficiency 2022.

This work is licensed under a Creative Commons Attribution-NonCommercial-NoDerivatives 4.0 International License.
※The aforementioned may not be copied for commercial use without the center's consent, thank you.※