Author / Liang Jyh Chang[1] , Adjunct Professor, Department of Chemical Engineering, National Taiwan University and Tsing Hua University
The petrochemical industry by definition uses petroleum or natural gas as the basic feedstock and produces a wide variety of products. In Taiwan, the industry contributes about 16.5 percent[2] of GDP with a complete and well-integrated production chain. However, the industry also contributes significantly to Taiwan's 270 Mt/yr CO2 emission. (Ritchie et al. 2020)
With the global trend and pressure to reduce carbon emissions and achieve net zero, we should take a close look at the industry and see what practically can be done to reduce carbon as much as possible.
First of all, it should be realized that oil and gas mainly consist of the chemical elements carbon and hydrogen (thus the term 'hydrocarbon'). The element of carbon, once "unearthed", cannot be destroyed or changed to other elements. The fundamental question is how do we avoid letting the carbon released into the atmosphere in the form of carbon dioxide (CO2).
The petrochemical industry's products can be largely divided into two categories: 1. As fuels that provide energy. The dominant examples are gasoline and diesel. 2. As materials that are used in all kinds of chemicals and plastics. For example, polyester, which is a polymer in almost everyone's wardrobe, is made of para-xylene, a C8 chemical derived from petroleum. In Taiwan specialty polymers and composites are also used in electronics, medical materials, car components, and other higher-value products.
Today many people predict that oil as a source of energy supplier could be replaced by renewables. However, as a material supplier, it is practically irreplaceable. The reason is economics and resource requirements. To produce the same amount of fibers in a typical 5,000 m2 synthetic fiber plant would require 1,600 km2 of cotton field land. The land and water requirement are way beyond what the earth could sustain.
If we look at the products from the point of view of the carbon element's final destination then the two categories are 1. CO2, and 2. Chemicals or plastics stores the carbon element in liquids or solids. Although carbon in some materials in the second category still has a chance to become CO2, we will focus our attention on the first category, CO2-producing, in this article.
I. CO2 Production Through Petrochem Industry
There are three main mechanisms CO2 is produced as a result of petrochemical processing. Let's take a close look at them so that we can think about how to mitigate carbon release:
- 2. Most of the petrochemical reactions require heating up the feed or the distillation towers for separation. The heating typically burns fuel gas in a heater or uses steam generated by boilers which also consume fuel gas or oil. Many machineries like compressors also may use steam as the power driver. For example, in a refinery, the crude feed needs to be heated to about 360°C (from~25°C ) before the crude enters the first distillation column. As you can imagine a lot of energy is needed to heat 200,000 barrels (31.8 million liters which is the capacity of CPC's Taoyuan Refinery[3] ) every day. Similarly, a naphtha cracker that makes ethylene needs to heat its feed to about 800°C.
- 3. Some of the processing units produce CO2 as byproducts. For example, a refinery's FCC (Fluid Catalytic Cracker, a major gasoline-producing unit) produces coke (pure carbon) as a result of its reactions. The coke wraps around its catalyst particles and makes the catalysts lose their activity. To regenerate the catalysts the coke needs to be burned and thus CO2 is generated. Another major unit is the H2 plant which supplies hydrogen to many hydroprocessing units in a refinery. Essentially all H2 plants in the world use steam methane reforming (SMR) which turns methane into H2 and CO2.
-
For example, in a typical refinery, the breakdown of energy consumption which is closely related to CO2 emission is roughly the following: 50% for heating, 30% for utilities like steam generation, 16% for H2 plant, and 4% for FCC.
Among the three mechanisms, the first emission is the most difficult to reduce because the final CO2 emission sources are mostly cars, trucks, and other vehicles. Each one is small and the emission points are highly scattered. This problem can only be alleviated by switching to renewables. The other two are concentrated within the processing plants and they are the focus of this article series.
II. Pathways to Reduce CO2
So how can we reduce the CO2 released into the atmosphere in the petrochemical industry? The measures can be summarized in an acronym SCUR which represents 4 words: Save, Capture, Utilization, and Renewable.
In this series of articles, I intend to introduce the technical aspect of the first 3 and provide an assessment of the most practical path to achieve the carbon reduction objectives. Some review papers (Saygin & Gielen, 2021) gave a wide variety of potential pathways. However, given the required timing and economics, most of the pathways are simply not feasible. We need to keep an open mind while focusing our attention and effort on what's realistically feasible.
The first one I would like to discuss in this series is Carbon Capture and Storage (CCS). This is a technology that has not been implemented in Taiwan but I believe should be an essential component in the pursuit of net zero. Let's review why Save, Utilization, and Renewable combined may not be sufficient.
Save: In the CO2-producing pathways mentioned above the second one is all about burning hydrocarbons to generate heat so energy saving is directly linked to carbon reduction. In the second article of this series, we will look into various ways energy saving can be done. For a petrochemical plant, the cost of energy is often more than 50% of its operation cost (besides feed cost) so there is a significant economic incentive to reduce energy whenever possible for its own sake. The question is: how much savings can be realistically achieved?
A prominent example is ExxonMobil's effort: in more than 10 years from 2002 to 2014, ExxonMobil reduced energy consumption by about 10%. This was a result of persistent effort with managers' continuous attention and diligent monitoring at all levels. This process is still going on today. This data is based on the author's personal experience as ExxonMobil's Energy Advisor in the Asia Pacific region. Are there more opportunities in each plant? Yes, however, the additional energy-saving opportunities usually involve more capital spending and thus more difficult to justify. So, I believe a 10% reduction is a reasonable estimate of what's achievable. If this is true it is certainly not sufficient by itself to make a major dent in carbon reduction.
CO2 utilization is a very appealing approach. Who doesn't like turning a hated component into useful and profitable products? However, compared to the almost 36 Gt of CO2 emitted from worldwide energy use each year the amount used today is less than 0.5 percent. Furthermore, the majority of the 0.5 percent is for Enhanced Oil Recovery (EOR).
In part III of this series, we will discuss some utilizations. At this point, it is sufficient to say that Carbon Utilization is more of a distraction from the real task of mitigation. As IPCC[4] concluded, "Industrial uses [excluding EOR] of captured CO2…are not expected to contribute to significant abatement of CO2 emissions."[5]
Renewable:
Renewable is the foundation of any climate change mitigation strategy. It has been making significant progress around the world and will continue to increase. The questions are: would it be sufficient to curtail the nearly 36 Gt/yr CO2 release by itself and in time to halt to 2 degree C increase? Is the world willing to pay for the extra energy and material cost if we stop using oil and gas?
For the petrochemical industry in Taiwan, we can take a look from several perspectives:
- Is it possible to change to electricity from renewables for heating in petrochemical plants? In theory, switching to heating by electricity from fuel gas is certainly doable. After all, heating a pot of water using either an electric pot or a gas cooktop seems fine. In reality, such industrial usage of renewables could be a very low priority with the limited amount of renewable electricity. Also, to change to electric heating in a plant requires a lot of equipment changes which means significant capital spending and turnaround scheduling issues. In addition, given the intermittent nature of the renewables most likely petrochemical plants would need to keep the fuel gas heaters as a backup.
BASF is one company that is trying to go this route. In its stated strategy[6] BASF invests directly in wind farms and also signs long-term (25 years) supply agreements with at least two major renewable suppliers to secure renewable electricity supply. While I admire BASF's determination, not many companies in the world have such clout and resource to do this.
- From a material's point of view oil and gas will most likely remain the main feedstock. The talk about using biomaterials as the feedstock to produce chemicals and plastics grossly underestimated the huge demand of the world and the land requirement. For example, the consumption of polyethylene alone exceeds 100 million tons a year. In addition, biomaterials are hydrocarbons also and need to deal with CO2 emission as part of their life cycles.
- From the competitive point of view petrochemical is mostly a commodity market in global competition. Unilaterally increase production costs in one country would most likely result in lost market share in the global market.
For the reasons cited above, I believe Save, Utilization, and Renewable alone are not sufficient. CCS needs to be an essential part of the total solution. In the following, I introduce the key components of CCS including some promising emerging technologies. We then take a look at the critical steps for Taiwan to take.
III. Carbon Capture and Storage (CCS)
CCS, in a nutshell, consists of 3 components: 1. CO2 is captured or separated from the emission sources, 2. It is then transported to the storage site which is a geologic formation deep underground that can securely store the CO2 for a long time, 3. CO2 is injected into the underground reservoir. The overall process is depicted in a simplified diagram (see Figure 1)[7]. I will introduce each component in the following sections.
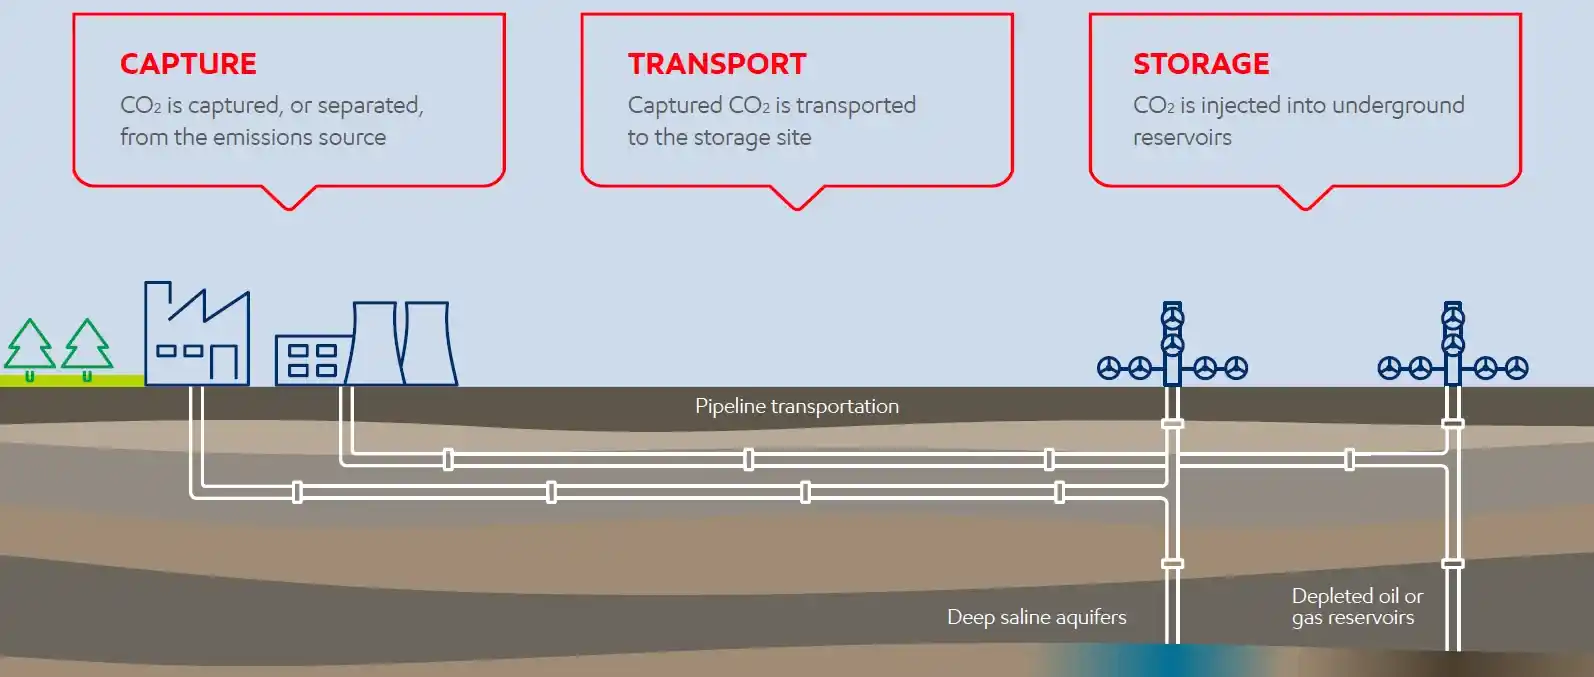
Figure 1. Carbon Capture and Storage Components
Source: ExxonMobil "The global leader in carbon capture and storage (CCS)."
A. Capture
Gases containing H2S and CO2 are commonly referred to as acid gas. Refineries and natural gas production plants have a long history of separating the acid gas from the desired products.
The main separation methods are amine absorption, membranes, and cryogenics. The dominant method presently is amine absorption. Figure 2 shows a typical amine-treating plant. The CO2-containing stream would enter the absorber at the bottom (Feed Gas stream 1) and counter-currently contact amines coming down from the top (stream 3). The absorber is typically filled with structured packing to maximize the contact between the fluids. Since CO2 is a weak acid and amine is a weak base CO2 is bonded with amine and exits the bottom (stream 4). The CO2-depleted gas leaves the system at the top (stream 2).
The CO2-rich amine is then regenerated in the regenerator which is typically a stripper with a reboiler that heats up the amines at the bottom. The reboiler is usually heated by steam. A critical aspect of the process is the temperature difference between the absorber and stripper. A typical temperature of the absorber is 50°C, while the stripper runs much hotter, typically at 110-120°C. The key is that amines have a greater affinity for CO2 at lower temperatures. By applying a temperature swing in the process, the amines capture CO2 at lower temperatures and release CO2 at higher temperatures. CO2 leaves the system at the top of the regenerator (stream 8).

Figure 2. A Typical Amine Scrubbing Plant for CO2 Capture
Source: J. Jechura, CBEN409 Petroleum Refining Notes, Colorado School of Mines, 2019.
There are multiple amines to choose from e.g., MEA (Monoethanolamine), MDEA (Methyldiethanolamine), DEA (Diethanolamine), etc. The choice depends on operating pressure, gas composition, heat requirement, etc.
The amine process typically captures a little over 90 percent recovery of the CO2 in flue gas. This is an economic optimum. Technically, the process can capture a higher percentage but the costs would increase significantly. The purity of the CO2 is very high, greater than 99% (Herzog, 2018).
Carbon capture is most effective on large, stationary sources of CO2 because the capture process exhibits significant economies of scale. The cost of an amine plant depends on the CO2 concentration and pressure of the feed gas. Besides capital spending to build the plant, the major operating costs are the energies to regenerate amines and compress CO2 to a pressure suitable for transportation (about 100 bar). The regeneration energy alone is about 70kJ/mole of CO2. This "energy penalty" can be 20-30% of a power station's energy output (Herzog, 2018).
If Taiwan were to implement CCS, I believe it would be most economical to pool CO2 from multiple other sources besides petrochemical, especially power stations, cement, and steel industry, and share a transportation network and storage site.
In summary, amine absorption is a well-known process with many vendors providing process design and a variety of amines. In Taiwan CPC and Formosa Plastics definitely have experience operating amine absorption plants to treat acid gas. However, the high energy penalty is a sore point and global research and development continue to improve the process and search for better alternatives.
I believe the two most promising alternatives at this point are Metal-Organic Frameworks (MOF) and Cryogenic Carbon Capture (CCC). However, both are not at the stage of commercialization yet.
MOFs are highly porous, crystalline frameworks comprised of multivalent metals bonded to multitopic organic linkers. MOF can be designed to adsorb CO2. It has the advantages of extremely high surface areas, high thermal and chemical stabilities, and tunable selectivity. When compared to amine absorption its desorption energy requirement is about 30kJ/mole, less than half of the amine process[8]. However industrial scale production and lower cost of MOF are still lacking. A couple of companies e.g., Promethean Particles are at the forefront of trying to commercialize the material.
Cryogenic Carbon Capture™ is a technology developed by Sustainable Energy Solutions (SES). The CCC process separates CO2 from light gases in essentially any continuous process. CCC cools the gases to the frost or de-sublimation point of CO2 (−100 to −135°C), separates and pressurizes the solids, and warms all streams to produce a CO2-depleted stream at ambient pressure and a pure (99+%) pressurized liquid CO2 stream typically at 150 bar, both at ambient temperature. CCC operates near the minimum energy required to perform this gas separation by minimizing stream recycling. CCC compresses CO2 as a liquid, which is one of several reasons it costs about half as much and consumes about half as much energy as an amine process (Hoeger et al., 2021; Baxter et al., 2021).
CCC's developer, Sustainable Energy Solutions (SES), has scaled this technology through several levels, the largest of which captures nominally 1 ton of CO2/day and is called the skid system. The skid system has conducted multiple field tests that include utility-scale power plants, cement plants, heating plants, and other utility or industrial sites that burn natural gas, biomass, coal, shredded tires, municipal waste, and combinations of these fuels. These field tests produced 95-99% CO2 capture with CO2 purities of 99+% and initial CO2 contents that range from 4 to 28%. SES currently seeks to scale up the system to a commercial scale of 10-80 tons of CO2 per day (Hoeger et al., 2021; Baxter et al., 2021).
Although still not officially commercialized yet I think CCC has the best potential to be a viable alternative to amine absorption.
The methods we discussed so far are all part of the Post-Combustion Capture. That is, the separation starts after the combustion and mainly separates CO2 from N2 (and other impurities). The so-called Pre-Combustion method instead separates out N2 first and uses pure oxygen in the combustion, so it is often called Oxyfuel Combustion. See Figure 3 for a simplified depiction. The combustion flue gas in this case consists of CO2 and steam (H2O), without the large amount of N2. The separation of CO2 is much easier because H2O can simply be condensed. The drawback is that, unlike the post-combustion capture, the furnace and its operation need to be modified because Oxyfuel combustion generates a much higher temperature. To date, there have been several pilot-scale projects but no commercial development yet.
Net Power, an ambitious power plant in Texas, seeks to provide "emissions-free power". It uses Oxyfuel combustion to burn natural gas. Different from the normal natural gas power plant, an innovation invented by the company is using the resulting CO2 to drive turbines, creating low-cost power with, as the company claims, zero-emission. It gives the company confidence to call itself a "supercritical carbon dioxide power plant". In this case, CO2 is no longer a waste but new energy. A demonstration plant has been in operation since 2018. This technology provides extra incentives to use Oxyfuel and reduces emissions for power stations. Please see Net Power's website for further information and the latest status.[9]

Figure 3. Oxyfuel Precombustion Capture
Source: Global CCS Institute
B. Transport
It is possible to transport CO2 as a gas or as a liquid. However, liquid CO2 pipelines are the preferred option for new infrastructure because of the much higher density of liquid compared to gas. This means that the pressure needs to be kept above CO2's critical pressure of 73.9 bar.
Transportation by ships is an alternative option for certain regions of the world to export their CO2 to other regions with more suitable geology for CO2 storage and requires lower investment costs than pipelines. CO2 would be transported as a refrigerated liquid under pressure. The transport conditions will be close to -50°C and 7 bar. For the volume expected at the scale of an industrial region, the unit transport cost of ships is higher than with pipelines. Ship transport does offer more flexibility. For example, Norway is developing a storage facility in the North Sea that would accept CO2 from numerous sites in several countries (Herzog, 2018). Transport of small quantities in tanker trucks would cost a lot more.
Since pipelines are the most economical method of transportation it is advantageous to have an existing network or potential network connections in place. The US, for example, has 6,500 kilometers of pipelines actively transporting CO2 today[10].
For Taiwan, a CO2 transport pipeline most likely needs to be sponsored or at least subsidized by the government with connections to major CO2 sources that include not just petrochemical plants but also power stations, steel plants, and major cement plants.
C. Storage
At the end of the transport, CO2 is then injected into a geological formation where it is expected to stay "permanently". In this section, we discuss the key considerations to achieving this goal. By "permanent" I mean at least 10,000 years. After all, oil and gas have been stored in geological formations for millions of years.
C-1. Geological Formations
A good geological formation for CO2 must meet four main criteria. First, it must be porous and permeable. That means it must have space (pores) to store CO2 and CO2 can move within the formation from its injection point (permeable). The rocks that best meet this criterion are sandstones and limestones (Herzog, 2018).
The second criterion is that above the sandstones or limestones there must be an impermeable caprock. This is because CO2 is buoyant, an impermeable caprock will keep it trapped in the formation. Thick shale layers, consisting primarily of clay, make an excellent caprock. The formation also needs to be in a trap which is a three-dimensional arrangement of rocks in the surface that will hold the CO2 inside a limited area[11].
The third criterion is the depth. To ensure that CO2 remains in a dense liquid-like phase, it needs to be stored at pressure higher than its critical pressure of 73.9 bar. Since the average hydrostatic pressure at 800-meter depth is 80 bar, 800 meter is the minimum depth of the target geological formation. The known CO2 reservoirs have a typical depth of 2-3 km, with pressures of 200-300 bar and temperatures of 60-100°C (Herzog, 2018).
The fourth criterion is storage capacity. A good storage formation should be thick and continuous over large areas to store large volumes.
The top candidates that satisfy these criteria are the depleted oil and gas reservoirs and deep saline formations. Deep saline formations are filled with salty water (saline) and are much deeper than drinking water aquifers. Ultimately, they will store the most CO2 because they are widespread and have much larger volumes than oil and gas reservoirs. Figure 1 includes both in the diagram.
For a CCS project to be successful the selection of geological formation carries the most uncertainty and needs careful study. As an example of the potential issues involved, please see the presentation about Australia's experience[12].
The question we are most concerned with is: are there suitable geological formations around Taiwan for CO2 storage? The Global CCS Institute regularly issues CCS Status Report which includes global geological assessment. The geographic areas are rated in four categories: Highly Suitable, Suitable, Possible, or Unlikely. The zoomed-in area around Taiwan in the latest 2021 report[13] is shown in Figure 4. As you can see the seabed in the east was rated as Suitable and the west was rated as Possible.

Figure 4. Potential Geologic Storage Areas Near Taiwan
Source: Global CCS Institute "Global Status of CCS 2021." p.71
Compared to our neighboring countries: China seems to have sufficient inland storage areas. Japan's Hokkaido and Japan Sea areas hold the most promise. Unfortunately, those are the less industrialized areas so CO2 transportation from major sources could be an issue. Korea, as well as India, lacks potential storage sites (Figure 5).

Figure 5. Potential Geologic Storage Areas Near Japan and Korea
Source: Global CCS Institute "Global Status of CCS 2021." p.71
C-2. Trapping Mechanisms
Geologic storage of CO2 is like the reverse of oil and gas production. Wells need to be drilled into the Earth but, instead of oil and gas coming out, CO2 is injected. Injection requires that CO2 be pressurized, typically in the range of 100-150 bar. The pressure in the injection pipe must be higher than the formation pressure, so that at the perforated interval at the bottom of the well, the pressure pushes the CO2 into the formation, where it displaces water and moves into the pores of the rock.
A video by Australian CO2 CRC demonstrating the displacement process can be found in Edinburgh online course[14]. A few snapshots of the video are shown in Figure 6. CO2 (in blue) pushed water out and eventually got trapped in the water bubble inside the pore.

Figure 6. Displacement of water by CO2 in a sandstone pore
Source: EDX Course "Climate Change: Carbon Capture and Storage." & CO2CRC- Saline aquifer CO2 storage and trapping.
Once CO2 enters the formation, the laws of nature take over and determine its fate. Four main mechanisms are working together to trap the CO2 in the formation: structured trapping, capillary trapping, solubility trapping, and mineral trapping.
Structural trapping refers to CO2 being trapped by the impermeable caprock. This is the basic requirement that must be met when deciding on the target formation.
Capillary or residual saturation trapping refers to CO2 being immobilized in the pore space due to capillary force, as the bubble in Figure 6 shows. It is a function of water and CO2 competing to move through the small pores between sand grains.
Solubility trapping refers to the solubility of CO2 in the formation of water. Mineral trapping refers to the reaction of formation of minerals with dissolved CO2 to incorporate the CO2 into new minerals, most commonly calcite. Mineral trapping is a very long process and its effect will not show up in hundreds of years.
The trapping mechanisms rely on different physics so their effects are additive. Their typical contributions and the gradual evolution of the contributions over time are shown in Figure 7. This is a study by the University of Edinburg[15].

Figure 7. CO2 Trapping Mechanisms
Source: EDX Course "Climate Change: Carbon Capture and Storage."
D. Storage Security and Monitoring
The assessment of CCS's storage security, i.e., whether it will leak or not, in general, says "if done properly, there will not be significant leakage". This is also IPCC's opinion[16](Herzog, 2018) and has been demonstrated in existing CCS and EOR projects.
However, the key success factor and also the one with the most uncertainty lies in the selection of an appropriate reservoir for geologic storage because the underground structure can only be assessed indirectly via seismic data.
There are multiple monitoring and mitigation methods to prevent leakage and ensure the security of storage. I am not going into any detail here. If you are interested in getting additional information please see the online course of Edinburgh[17].
E. CCS Projects Around the World
The IPCC estimated that 5-10 Gt of carbon dioxide must be removed from the atmosphere each year in the second half of this century (Herzog, 2018). The Global CCS Institute's 2021 report lists about 135 commercial CCS projects around the world[18]. The currently operating capacity is 36.6 Mt CO2/yr. (see Figure 8). The new projects at various stages of development will increase the total to close to 150 Mt/yr. This is still far below the 5-10 Gt/yr target so CCS projects need to increase significantly.
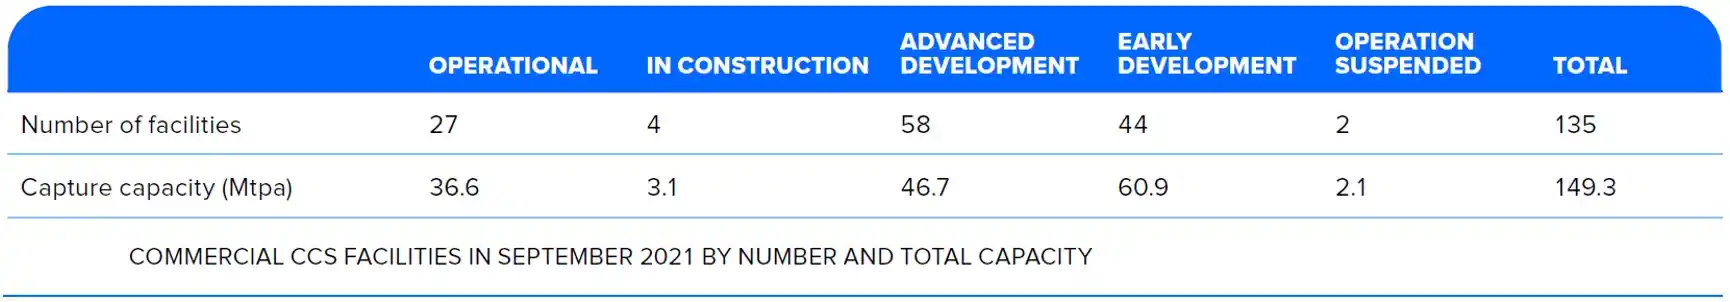
Figure 8. Global CCS Facilities – Operational and Planned
Source: Global CCS Institute "Global Status of CCS 2021." p.14
Figure 9 lists the latest projects in the Asia Pacific Region[19]. It can be seen that, besides Australia and China which have been active in CCS, Malaysia and Indonesia are also in the early development of CCS projects.

Figure 9. New Commercial CCS Projects in Asia Pacific Region
Source: Global CCS Institute "Global Status of CCS 2021." p.33
IV. CCS in Taiwan
CCS's are large-scale investment projects. With the size of Taiwan, it would be best done with a coordinated effort with the government's active involvement.
To progress CCS in Taiwan the following are the first steps:
- Identify suitable geologic reservoir sites. Taiwan has no oil or gas production on or around the island but likely has saline formation around, as shown in Figure 4 from Global CCS Institute's database.
- Identify major CO2 sources for capture and storage. Power stations (e.g., Taichung power plant), steel manufacturing (China Steel), major cement plants, and petrochemical production clusters (e.g., Kaohsiung, Mailiao) could be the main candidates.
- Plan potential collection and transport network. As mentioned above, if a pipeline network needs to be built most likely government subsidy or direct sponsorship is needed. Incentive plans like US's 45Q tax credit will encourage companies to participate and invest. 45Q, passed in 2018, provides $50/t CO2 for geologic storage and $35/t CO2 for EOR. The Inflation Reduction Act of 2022 increases the tax credits to $85 and $60 per ton respectively. This Act also provides $180 per ton for direct CO2 capture from atmosphere. Similar tax incentives can be considered in Taiwan to encourage industrial participation.
The following are some resources that could be useful for the development of a CCS strategy:
- United Kingdom's Department of Energy and Climate Change has issued a Carbon Capture Readiness document[20].
- Global CCS Institute offers a database, case studies, and consultancy[21].
- Scotland CCS (SCCS.org.uk) maintains a global CCS project map. Key information about each project is included in the database[22].
- Oil companies have the most experience working on geology, well development, and using CO2 for EOR. For example, ExxonMobil has a global effort to implement CCS[23]. Some of these companies may offer technology licensing or consulting services.
V. Concluding Remarks
Phasing oil and gas – and their CO2 emissions – entirely out of the global economy is, at best, very expensive, and, at worst, impossible within the timescale for action on climate change. For the petrochemical industry (and also the power, cement, and steel industry) CCS is a pragmatic component of the overall carbon reduction solution. With the information presented above, I wish to increase awareness and understanding of what CCS is and what it can do. I hope to see a CCS strategy and an implementation plan developed for Taiwan in the very near future.
Note:
[1] Professor Chang also serves as an independent advisor for companies in Taiwan, Europe, US, and China. He retired from ExxonMobil as a Distinguished Engineering Associate and also previously worked for Dow Chemicals.
[2] 經濟部研究發展委員會-109年度新經濟發展諮詢會議-【與會分享】疫情後之經濟變局議題(台灣綜合研究院總督導 中國石油學會 林茂文2020.07.28)
[3] CPC: CPC corporation, Taiwan. It is a state-owned petroleum refining enterprise.
[4] Intergovernmental Panel on Climate Change
[5] IPCC, Carbon Dioxide Capture and Storage, 8.
[6] "BASF Report 2021-BASF on the Capital Market Strategy."
[7] ExxonMobil "The global leader in carbon capture and storage (CCS)."
[8] Promethean Particles and University of Nottingham (2022). MOF Whitepaper, "Metal-Organics Frameworks (MOFs) as industrial scale, cost effective adsorbents for Carbon Capture and Storage (CCS) Application."
[10] EDX Course "Climate Change: Carbon Capture and Storage."
[11] EDX Course "Climate Change: Carbon Capture and Storage." / Global CCS Institute. "Secure Geologic Storage of CO2."
[12] Tenthorey, E. "CO2 Storage in Australia."
[13] Global CCS Institute (2021). "Global Status of CCS 2021."
[14] EDX Course (2022). "Climate Change: Carbon Capture and Storage."
[15] EDX Course "Climate Change: Carbon Capture and Storage."
[16] IPCC, Carbon Dioxide Capture and Storage, 8.
[17] EDX Course "Climate Change: Carbon Capture and Storage."
[18] Global CCS Institute "Global Status of CCS 2021."
[19] Global CCS Institute "Global Status of CCS 2021."
[20] UK Department of Energy & Climate Chang (2009). "Carbon Capture Readiness (CCR): A guidance note for Section 36 Electricity Act 1989 consent applications."
[21] Global CCS Institute "CCS Strategy."
[22] SCCS "Global CCS Map."
[23] ExxonMobil "CCS in action."
- Baxter, L., Hoeger, C., Stitt, K., Burt, S. & Baxter, A. (2021). "Cryogenic Carbon Capture™ (CCC) Status Report." 15th International Conference on Greenhouse Gas Control Technologies, Abu Dhabi, March 15-18.
- Herzog, H. J. (2018). Carbon Capture. Cambridge, MA: MIT Press.
- Hoeger, C., Burt, S., & Baxter, L. (2021). "Cryogenic Carbon Capture™ Technoeconomic Analysis." 15th International Conference on Greenhouse Gas Control Technologies, Abu Dhabi, March 15-18.
- Ritchie, H., Roser, M. & Rosado, P. (2020). "CO₂ and Greenhouse Gas Emissions." Retrieval Date: 2022/08/15.
- Saygin, D. & Gielen, D. (2021). "Zero-Emission Pathway for the Global Chemical and Petrochemical Sector." Energies 14(13): 3772.

This work is licensed under a Creative Commons Attribution-NonCommercial-NoDerivatives 4.0 International License.
※The aforementioned may not be copied for commercial use without the center's consent, thank you.※
Petrochemical Industry's Pathways to Carbon Reduction: II. Energy Saving