


- 研究主題
- 媒體與出版
- 國際交流
台大風險中心自2017年持續關注台灣前十大溫室氣體排放企業,並自2019年起定期發佈「企業氣候行動追追追」專題,追蹤台灣高碳排產業與企業的排放變化。2025年為專題邁入第七年,我們持續更新環境部最新公告的(2023年)
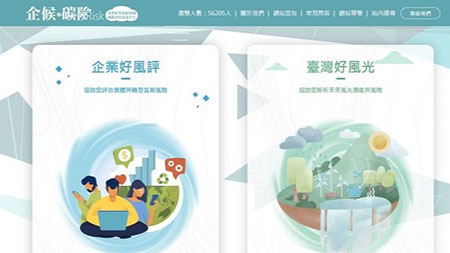
臺灣產業氣候變遷風險評估資訊平臺由兩個子網站構成,企業好風評能協助企業評估自身的實體(physical)與轉型(transition)風險,臺灣好風光則能協助風能及光能業者規劃未來佈局。
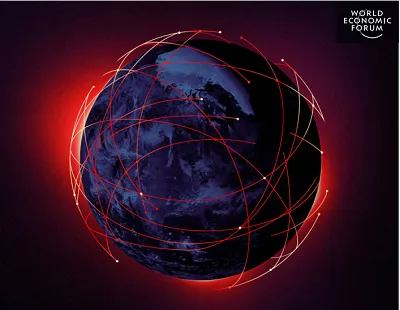
世界經濟論壇於2025年1月發布《2025全球風險報告》,主要重點是在於討論「分裂」(fragmented),包含四個面向的分裂風險:環境面向的分裂風險為「極端天氣事件」、政治面向的分裂風險為「地緣政治衝突」、社會面向的分裂為「社會極化」,與科技面向的分裂風險為「錯誤訊息與假訊息」。
近年,在永續治理的發展趨勢下,國際上關於「企業與人權」議題的發展,在2020年前後迎來了一波法制化的浪潮。

台灣於2023年通過氣候變遷因應法(以下簡稱「氣變法」),許多部會也推動相關的管制措施。然而,在管制之外,氣候變遷的因應還需要推動長期、結構性的轉型準備。一方面政府應該將氣候納入整體發展策略的思考,還必須要能帶動企業與市場的低碳轉型,才可能強化台灣在淨零未來時代的競爭力。

面對國際間如火如荼的推動淨零碳排,我國則於2022年3月公布2050淨零排放路徑及策略總說明;同年12月公布12項關鍵戰略行動計畫,各部會分別主責12項戰略之個別項目,並成立淨零辦公室;2023年1月中《氣候變遷因應法》立法通過後,政府成立相關推動組織、制定階段性減碳政策目標、擬定具體行動方案及進行必要的社會溝通,已成為淨零轉型治理的重點工作。
臺大風險中心自2022年開始進行企業氣候相關財務揭露調查,每年持續深化議題,今年(2025年)已邁入第四年,在原氣候財務揭露調查報告架構下,首度強化永續金融、並加入勞動人權與盡職調查等面向
由國家發展委員會委託辦理淨零公正轉型利害關係人辨識研究,臺大風險社會與政策研究中心首次與台灣世界展望會(以下稱「展望會」)、台灣發展研究學會共同進行「台灣能源公平調查」,探究經濟弱勢家庭在能源支出、能源效率與成本負擔問題,以掌握社經弱勢者問題結構特性,作為建立基於實證調查之能源公平政策建議。

臺大風險中心連續三年進行「企業氣候相關財務揭露調查」,於每年論壇活動公開發布調查摘要簡報並撰寫電子報專文介紹。今年2024第三屆調查報告歷經數月編輯、彙整前兩年調查結果,現發行正式報告,歡迎各界公眾瀏覽下載參考。

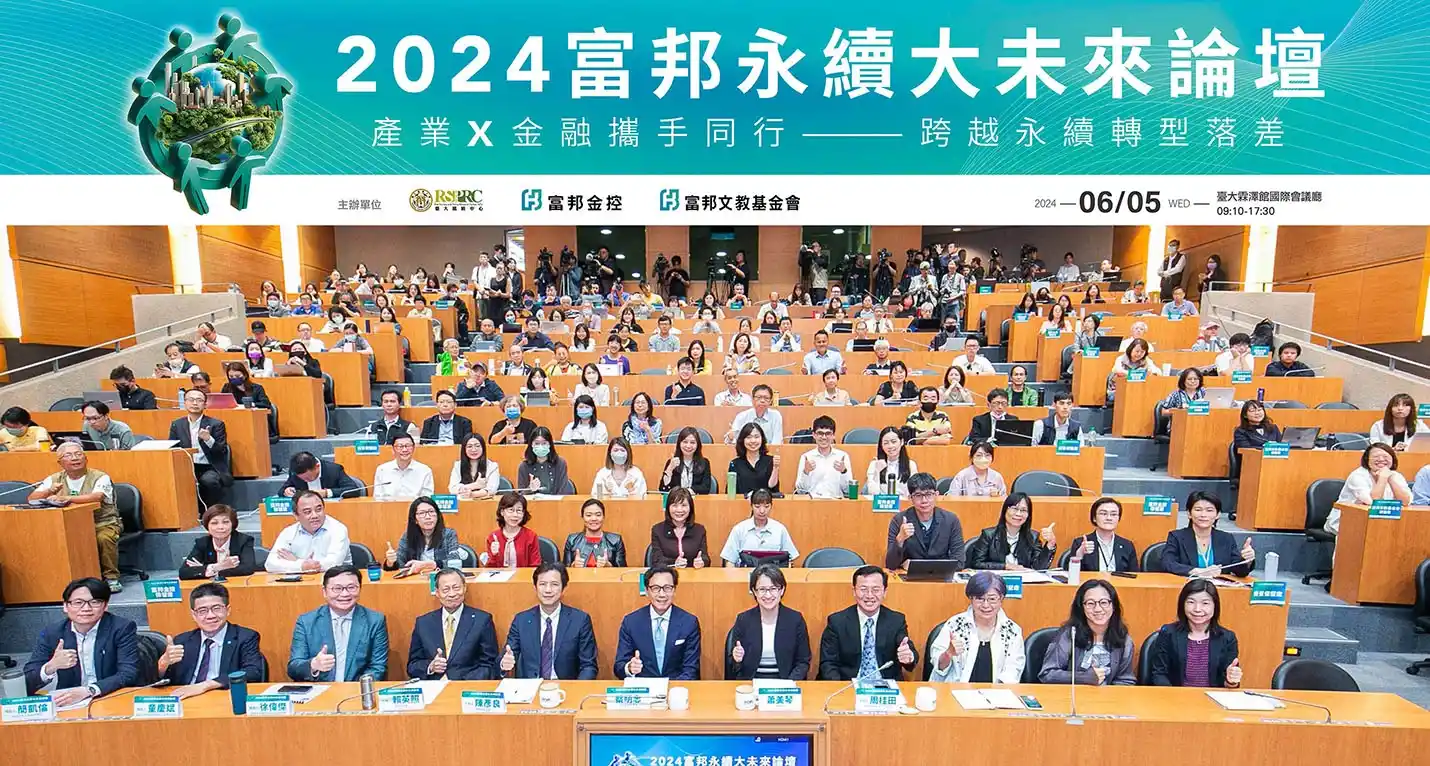
臺灣大學風險社會與政策研究中心自2022年開始進行企業氣候相關財務揭露調查,在富邦金控持續贊助支持下,於2023年擴大調查範圍,於今(2024)年延續深化此重要議題,並在6月5日...
臺大風險中心連續兩年進行「臺灣高碳排產業之公正轉型調查」,今(2023)年亦於聯合國氣候大會後發表最新調查結果。近年「公正轉型」已經成為聯合國氣候變化綱要公約、全球金融機構、企業、勞工的焦點所在。
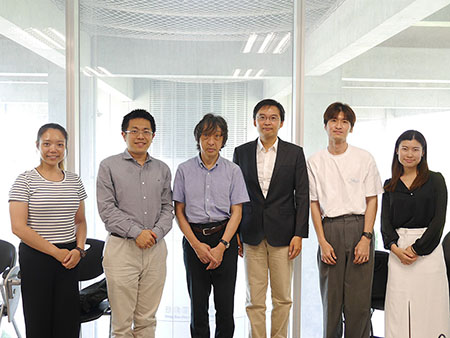
日本東北大學明日香壽川教授於2025年7月23日來訪本中心,與中心研究員國發所林竣達助理教授、政治系李仲軒助理教授及中心同仁進行交流,聚焦於日台氣候與能源政策及其政經情勢。席間亦分享了本中心近期研究重點與未來合作方向的構想。

日本京都大學地球環境學堂副教授Gregory Trencher於2024年11月20日至22日拜訪臺灣大學風險社會與政策研究中心進行學術交流及討論研究合作對接。他的研究專長為去碳化政策與國際再生能源供應鏈、氫能與永續能源、次世代移動、自願性碳市場,受邀於2024年11月20日發表演講 ...
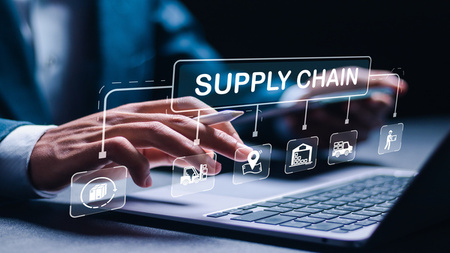
荷蘭恩荷芬理工大學(Eindhoven University of Technology)助理教授Mila Davids於2024年6月24日拜訪風險中心,分享近期研究關於半導體產業供應鏈所面臨的永續挑戰。中心周桂田主任、林竣達研究員、李仲軒研究員與中心成員也一同與來訪學者交流風險中心近期在產業永續轉型、能源相關議題上的研究成果及未來的工作計畫。
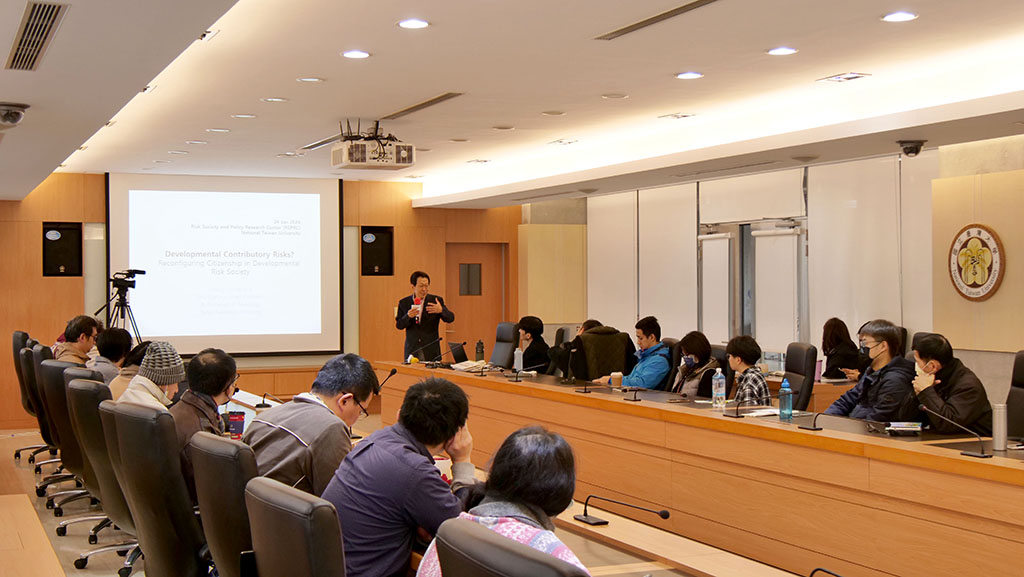
台灣大學風險社會與政策研究中心(以下簡稱本中心)於2024年1月24日舉辦「發展引發風險?重新定義發展風險社會中的公民身份(Developmental Contributory Risks? Reconfiguring Citizenship in Developmental Risk Society)」國際交流演講,主講者為韓國首爾大學社會學系特聘教授張慶燮(Kyung-Sup Chang)。本場演講由本中心周桂田主任主持、與談,同時也邀請到台大地理環境與資源學系簡旭伸教授與談。
本場演講張教授分享了「風險公民」(risk citizenship)在社會政治及相關領域的理論與實務意涵,並佐以韓國社會的案例分析。面對隨時可能併發的系統性風險,風險公民的特殊意義在於,要求政府能在識別轉型風險對公民造成的侵害,更須公平地為後者建構出相應的補償機制。
在張教授演講後,周桂田主任及簡旭伸教授分別以世界公民方法(cosmopolitan approach)與風險社會溝通為主題,與張教授的「風險公民」概念有精彩的對話與交流。演講最後由周主任總結,肯認面對東亞社會的轉型困境,細緻的社會政治分析與國家間風險情境的參照,才能為東亞社會的淨零轉型建構緊密的合作基礎。
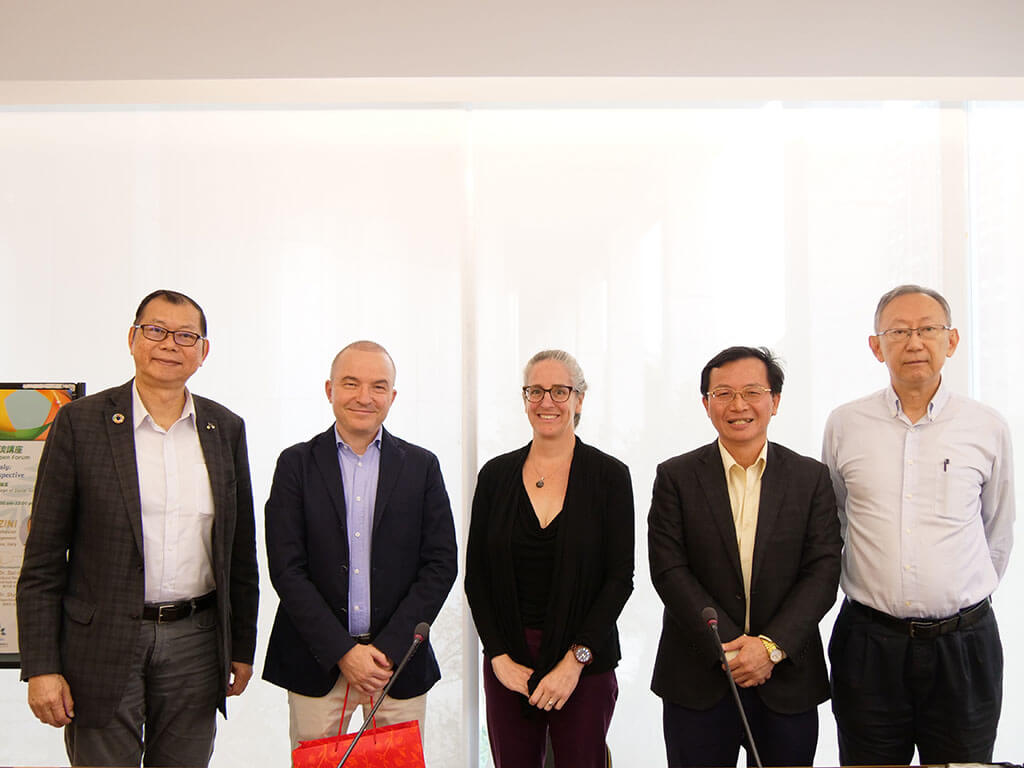
臺灣大學風險社會與政策研究中心(下稱臺大風險中心)於今年(2023)11月30日(星期四)邀請威尼斯大學管理學系Pietro Lanzini副教授來訪,並以「義大利的運輸電動化:一個通勤者為本的觀點(“The Electrification of Mobility in Italy: A Commuter-based Perspective”)為題進行專題演講。同場邀請到中研院經濟研究所蕭代基兼任研究員,以及臺灣大學土木工程學系張學孔教授共同與談。
Lanzini副教授先以簡單的自我介紹開場。他的研究興趣主要聚焦在永續的消費者行為,包括在運輸業、食品業以及飯店餐飲業等行業。他舉例自己在威尼斯大學所教授之行銷與管理,課程名稱已改為「永續管理」(Management E Sostenibilità),該系未來已規劃將永續發展納入多數課程。第三,他在研究方法上著重原始數據,藉由對消費者進行訪談或網路調查等途徑蒐集資訊。接著,他說明本次演講將涵蓋四大主題,分別是「永續:真的重要嗎?」;「私人車輛在環境退化裡的角色」;「電動化以及參與的主要行為者」:「從政策制定者到汽車產業;通勤者為本的觀點」。
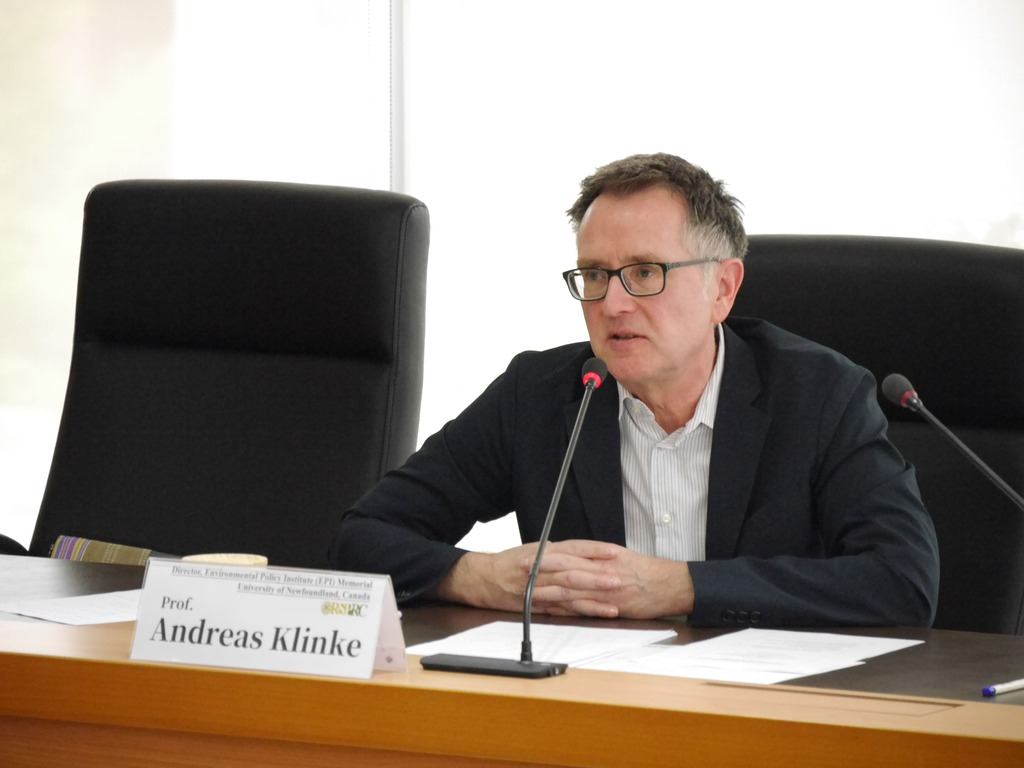
台灣大學風險社會與政策研究中心(以下簡稱台大風險中心)於2023年7月26日舉辦「後常態政治與不確定性及風險治理(Postnormal Politics and Governance of Uncertainty and Risk)」演講,主講者為Andreas Klinke教授,本場演講同時邀請台灣大學社會學系何明修教授、政治大學創新國際學院楊智元助理教授與談。
Klinke教授指出,我們正在經歷劇烈的變化,就如同由Ulrich Beck所提出的工業革命所帶來的社會變革。在這樣的變化中,新舊不確定性(uncertainty)、各種風險(risk)無可避免地交織在一起。他接著提到由社會學家John Urry提出的「全球社會物質系統(global socio-material system)」,並用此概念來描述議題與未獲滿足的需求之間,無可避免的自然和社會交互關係(natural-social interrelations),例如在氣候、能源、生物多樣性、全球經濟和政治議題中會產生的現象。
Klinke教授接著分享,政治學和政治社會學專家已經認知到,傳統的民主治理面臨著分裂、缺乏協調、低效和無效等挑戰。正如在應對Covid-19疫情、氣候變化和脫碳政策中所見,這些問題同時存在於國內和全球治理中。Klinke教授提出了「後常態政治和不確定性及風險治理(Post-normal Politics and Governance of Uncertainty and Risk)」,以改進傳統的風險相關決策、政治和監管方法。這個概念主張,在治理中納入審議民主,以處理不確定性和風險。

ENERGY
專欄
- Open Energy
- 國際永續新知
台大風險中心自2017年持續關注台灣前十大溫室氣體排放企業,並自2019年起定期發佈「企業氣候行動追追追」專題,追蹤台灣高碳排產業與企業的排放變化。2025年為專題邁入第七年,我們持續更新環境部最新公告的(2023年)
隨著新政府的上任,台灣淨零轉型邁入新的階段。在2024年世界地球日,賴清德總統正式宣示推動二次能源轉型,強調透過多元綠能、深度節能及先進儲能三大主軸,兼顧供電穩定淨零轉型目標。

城市雖然僅占地球總面積的3%,卻有一半以上的全球人口居住於此,其經濟活動占全球GDP的80%;同時,城市消耗了全球三分之二的能源,並每年產生超過70%的溫室氣體排放。這些數據反映了城市在全球能源消耗和碳排放中所占的主導地位,顯見城市的高密度人口與經濟活動不僅對有限的能源資源帶來壓力,也突顯城市在應對氣候變遷的關鍵角色和責任。
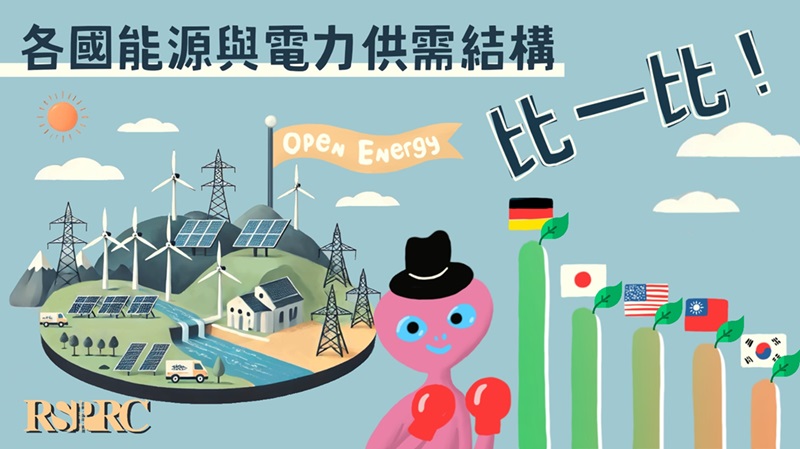
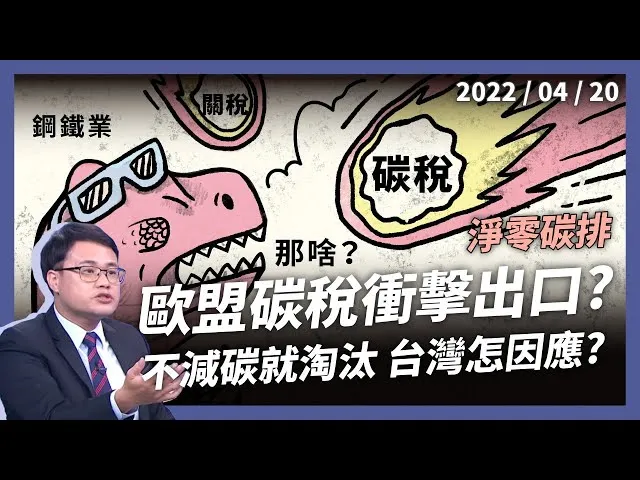
2023年台灣出口總額為4,324億美元,我國十大出口產品包括電子零組件、資通與視聽產品、基本金屬及其製品、機械、塑橡膠及其製品、化學品、礦產品、電機產品、光學及精密儀器、運輸工具及紡織品(財政部,2024)。從這些主要出口產品可以看出,台灣的核心產業對能源和電力需求量高,使台灣的經濟成長與能源和電力密不可分。今年八月,《遠見雜誌》以「沒電力就沒國力的AI時代,10%綠電撐得起台灣矽谷?」作為封面標題,突顯在半導體業、AI產業用電需求增長的情況下,如何找到同時兼顧淨零目標與產業發展的能源黃金組合?《今周刊》也以「搶救!全民缺電焦慮」為題,顯見台灣各界在「減媒、增氣、展綠」能源轉型目標與進度落差的擔憂。

台大風險中心自2017年關注台灣前十大溫室氣體排放企業,並自2019年發布第一篇企業氣候行動追追追專題,每年持續追蹤台灣溫室氣體排放量名列前茅之產業與企業。今年2024企業氣候行動追追追已邁入第六年,從排碳大戶應盤查登錄的溫室氣體排放量最新數據,看2022年排碳大戶從2021年289家增加至550家的排放量與家數變化,並了解排放關鍵產業與前三十大溫室氣體排放企業。
COP28 通過的「阿聯酋共識」(UAE Consensus)呼籲各締約方在2030年將全球再生能源裝置容量提高到2022年的三倍,或至少達到11,000GW;同時要求2030年之前,能源效率年均改善率從2%提升至4%,相當於2022年的兩倍(COP28 UAE, 2023)。這項目標不僅將成為全球2050淨零排放路徑的重要里程碑,同時也伴隨著巨大的能源轉型治理挑戰。
世界經濟論壇於2025年1月發布《2025全球風險報告》,主要重點是在於討論「分裂」(fragmented),包含四個面向的分裂風險:環境面向的分裂風險為「極端天氣事件」、政治面向的分裂風險為「地緣政治衝突」、社會面向的分裂為「社會極化」,與科技面向的分裂風險為「錯誤訊息與假訊息」。

在國際永續金融平台於2021年發布歐盟和中國主導的「共同分類標準-氣候變遷減緩」報告後,各國紛紛加速擬定永續分類標準的議程。其中,新加坡不僅在CGT基礎上制定分類標準,更進一步在2023年12月推出「新加坡-亞洲分類法」。

024年世界經濟論壇的《2024年全球風險報告》在開頭即提醒全球領導人,世界局勢正受氣候變遷與地緣政治衝突兩大危機嚴重影響,全球的前景仍充滿著不確定性,全球面臨地緣、人口與科技以及氣候變遷等四結構的系統性轉變。而今年報告的重點也在於這些結構性力量是如何導致全球風險與危機的提升。
全球各地的政策制定者採用各自永續分類標準,部分國家正在擬定各自的分類標準,幫助投資者、企業和金融機構識別和支持環境友善投資。然而,不同國家和地區對於永續經濟活動的定義不同,也使國際間永續投資面臨挑戰。
《2023年全球風險報告》針對未來一年、未來2年、與未來10年的風險重大性,與風險治理成效進行彙整分析,並提出「多重危機(Polycrises)」壟罩下的新興未來可能與相關籌備建議,以下將分成五個部分說明。
你聽過氣候相關財務揭露嗎?是由金融穩定委員會於2017年發佈「氣候相關財務揭露建議書」後,全球各企業不僅紛紛響應簽署TCFD倡議成為支持者,而且更進一步地於永續報告書、財報,或網站等處,提供TCFD架構下的「治理」、「策略」、「風險管理」、「指標與目標」的風險與機會揭露資訊,以協助投資者與決策者了解企業面臨氣候變遷的因應措施,以及進一步可提升企業永續經營的競爭力。


台大風險中心(以下簡稱本中心)自2023年起辦理「青年淨零力實踐平台」專案,透過此專案中的執行重點──淨零青年學院,盼能形塑本中心為大專院校學生的永續培力樞紐。於此基礎上,本中心陸續辦理第一屆及第二屆淨零青年學院,並持續拓展網絡量能,盼能彼此借力使力,藉由學院的常態化辦理,與青年共同落實台灣的轉型願景。
本場次主講者為佐藤勉,現任日本金融廳綜合政策局參事與中曽根和平研究所主任研究員,長年參與日本能源轉型與國際金融治理架構。他的演講主題為「日本的綠色轉型(GX)與轉型金融」(Green Transformation and Transition Finance),從歷史、政策、制度與市場四個層面全方位解析日本推動碳中和的實務經驗。
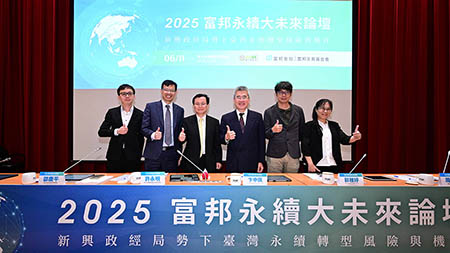
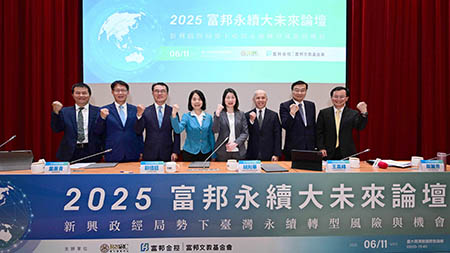
本場次發表了由台大風險中心所執行的《2025企業永續揭露準備度調查》。會議由台大風險中心周桂田主任主持,並邀請亞東科技大學郭雅婷助理教授與政治大學卞中佩助理教授進行調查結果分析。

論壇首先由行政院國發會高仙桂副主委致詞。他表示,今年論壇除了展示臺大風險中心針對企業永續準備度的調查成果,也為政府在企業ESG評量及政策制定上提供重要依據。
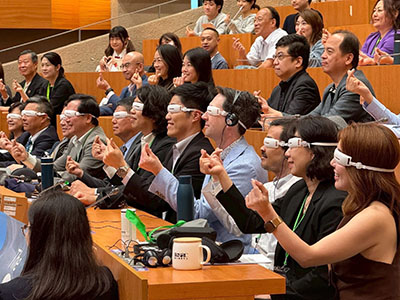
臺大風險中心與歐萊德(O'right)等單位合作,於今年度(2025年)4月14日在臺大霖澤館國際會議廳共同舉辦《IPCC學者國際論壇:北極的最後一塊冰,格陵蘭冰川冰融全球危機》紀錄片首映暨專題論壇。
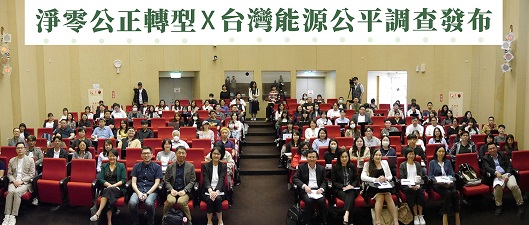
2025年4月9日,臺大風險中心於社科院梁國樹國際會議廳舉辦「淨零公正轉型X台灣能源公平調查發布論壇」。本活動為國家發展委員會「113年與NGO共同推動淨零公正轉型相關活動」委託辦理案,淨零公正轉型利害關係人辨識研究之關鍵溝通論壇...